How to Analyse the Forex Market Before Opening a Trade
Forex market analysis is not one method but a sequence: what the macro backdrop wants, where the positioned money sits, what the chart's structure says, and whether the session you are in can deliver the move. This guide lays out that sequence as a pre-trade routine you can finish in twenty minutes, with the questions to answer at each step and the signs that tell you to stand aside.
Forex market analysis goes wrong in a predictable way: the trader opens a chart, sees a pattern, and then looks for reasons to take it. The order is backwards. A currency pair moves because of the difference between two economies, the money already positioned in it, and the liquidity sitting above and below price, and the chart is the last place those forces show up. The routine below runs in the opposite direction, from the slowest force to the fastest, so that by the time you look at an entry you already know which way you are allowed to trade and whether today is a day to trade at all. It takes about twenty minutes before a session and uses nothing you cannot get for free.
The order of analysis
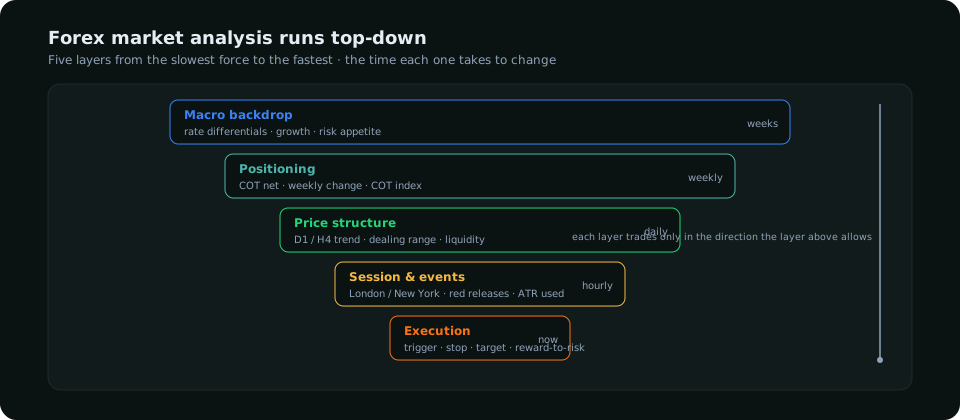
Each layer answers one question. Macro: which currency should be gaining over weeks? Positioning: is the crowd already there? Structure: which way is price actually travelling, and where is it in its range? Session: can the hour you are in deliver a move? Execution: is there a trigger with a defined stop? Spend time in proportion to how often each changes. Macro barely moves week to week; a trigger changes every hour.
Step 1 — macro: which currency should be gaining?
A pair is a ratio of two economies, and the force that moves it over weeks is the expected path of interest rates in each. You do not need to forecast central banks; you need to know what the market is already pricing and whether the recent data pushed that pricing up or down. Three checks cover it: the direction of each country's two-year yield over the past month, the last two or three top-tier releases (inflation, employment, growth) and whether they beat or missed, and the broad risk tone (equities and credit rising favours the higher-yielding and commodity currencies; falling favours the dollar, yen and franc). The fundamental analysis guide explains how each release feeds into rate expectations. Write the result as one line: "EUR/USD macro: dollar favoured, US yields up 25 bp on the month, euro data missing."
Step 2 — positioning: is the crowd already there?
Macro tells you the direction the smart money has reason to want; the weekly COT report tells you whether they already own it. A bullish macro story with speculators at a three-year record long is a story that is mostly priced; the same story with the crowd mid-range and building is one with fuel. Note two numbers per currency: the net position's place in its range (the COT index) and the weekly change. Then adjust the macro line: "crowded long euro, 88th percentile, still adding" means the bearish euro view from macro has an extra reason to work when it starts. Positioning does not time anything; it tells you which side has further to run and which side is exposed.
Step 3 — structure: which way is price travelling?
Now the chart, and the daily and four-hour charts first. Mark the swing highs and lows that define the trend: higher highs and higher lows, or lower highs and lower lows. Mark the dealing range between the last significant swing high and low and note whether price is in the upper half (premium) or lower half (discount) of it. Mark the obvious liquidity: equal highs and lows, the previous day's and week's extremes, big round numbers. The smart money concepts guide walks through each of these. Then compare with steps 1 and 2. Alignment (macro bearish, crowd long and exposed, daily structure making lower highs) is the condition for a high-conviction day. Conflict (macro bearish but daily structure still making higher highs) means you either wait for the structure to turn or trade smaller and shorter.
Step 4 — session and events: can this hour deliver?
| Check | Question | If no |
|---|---|---|
| Session | Is the pair in a session that moves it? (London or New York for the majors, Asia for yen and Australian dollar crosses) | Wait for the open; a signal in a dead session usually drifts |
| Calendar | Is there a red release for either currency in the next two hours? | Do not enter into it; plan the post-release trade instead |
| Volatility | Is today's range so far a normal fraction of the daily ATR? | If the day has already travelled its ATR, the remaining move is small |
| Correlation | Are the dollar index and the related crosses agreeing with your direction? | A lone pair moving against its peers often reverses |
The session guide covers when each pair is actually active. The calendar check is the one traders skip most and regret most: an entry fifteen minutes before a rate decision is a coin flip wearing a thesis.
Step 5 — execution: a trigger with a defined stop
Only now does the entry chart matter, and only in the direction the layers above allow. A trigger is a specific event, not a feeling: a sweep of a marked liquidity level followed by a displacement back the other way, a break of structure on the hourly chart and a retest, a rejection candle at a marked zone. Each trigger carries its own stop (beyond the sweep, beyond the zone) and its target is the next marked liquidity in the direction of the bias. If the stop-to-target ratio is below 1 : 1.5 the setup is not worth the risk; if there is no clear invalidation level, there is no trade.
The pre-trade card
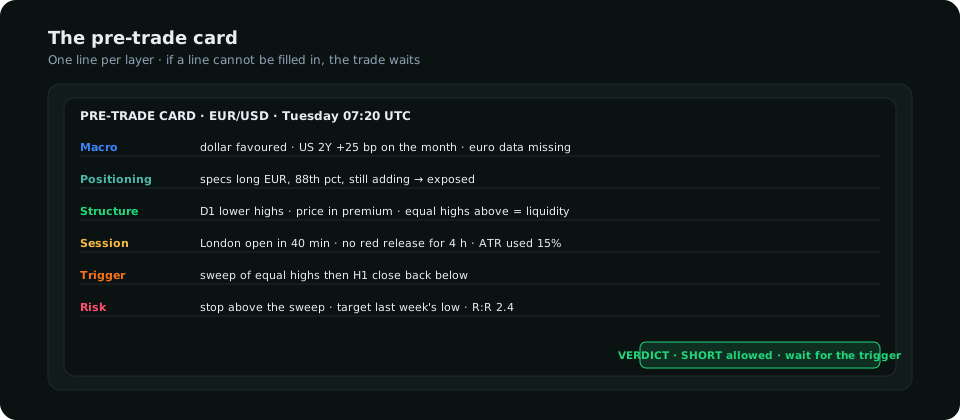
Writing the card is the discipline, not the card itself. It takes two minutes once the analysis is done and it converts an impulse into a decision with a direction, a condition, a stop and a target. Traders who keep these cards for a few months find that their losing trades cluster in the ones where a line was fudged, usually the session or the invalidation level.
When the answer is no trade
- Macro and structure disagree and the structure has not turned. Wait; this is where most forced trades happen.
- A red release is inside the next two hours for either currency.
- The daily range is spent: the pair has already moved more than its average daily range and the session is half over.
- No invalidation: you cannot name the price at which the idea is wrong.
- Correlations are fighting: the pair is moving alone against the dollar index and its sister crosses.
Standing aside on those days is not a missed opportunity. The pairs will be there tomorrow with a cleaner setup, and the capital will too.
Making it a habit
The routine is the same every day, so build it into a daily workflow with a fixed time and a fixed order. Most of the first three layers are done once a week (macro and positioning change slowly) and merely re-read each morning; the structure, session and execution layers are the daily work. On SMC Terminal the first three layers are laid out per pair, with the positioning, valuation and macro reads composed into a single bias, so the morning routine starts at step 3.
Frequently asked
How long should forex market analysis take?
About twenty minutes before a session once the weekly macro and positioning notes are in place. The daily work is structure, the calendar and the session; the rest is re-reading.
Which timeframe is best for forex market analysis?
Daily and four-hour charts for direction and range, the hourly for the trigger. Lower timeframes refine the entry but never decide the direction.
Can I trade against the macro bias?
You can, with a smaller size and a shorter horizon, when the structure has clearly turned against it. Most counter-bias trades are better skipped; the ones worth taking announce themselves with a structural break, not a feeling.
Everything on SMC Terminal is analysis and education, not a recommendation to buy or sell. Figures in the example are illustrative. Trading carries a substantial risk of loss. Manage your risk.