Moving Averages in Forex: Trend Direction, Crossovers and Limitations
A moving average is the simplest trend tool in forex and the most misused. This guide covers what SMA and EMA actually measure, how to read slope and distance rather than crossovers, the settings traders use on each timeframe, and the two conditions under which every moving average fails.
A moving average is the average closing price over the last N candles, redrawn every candle. That is the whole indicator. It smooths price so the direction of the last N periods is visible at a glance, and it does so at a cost: it lags, by roughly half its length. Everything useful about moving averages in forex follows from those two facts, and so does everything that goes wrong with them. This guide covers the two types, what to read from a moving average (slope and distance, more than crossovers), the settings in common use, and the two market conditions in which no setting works.
SMA and EMA: the same idea, different memory
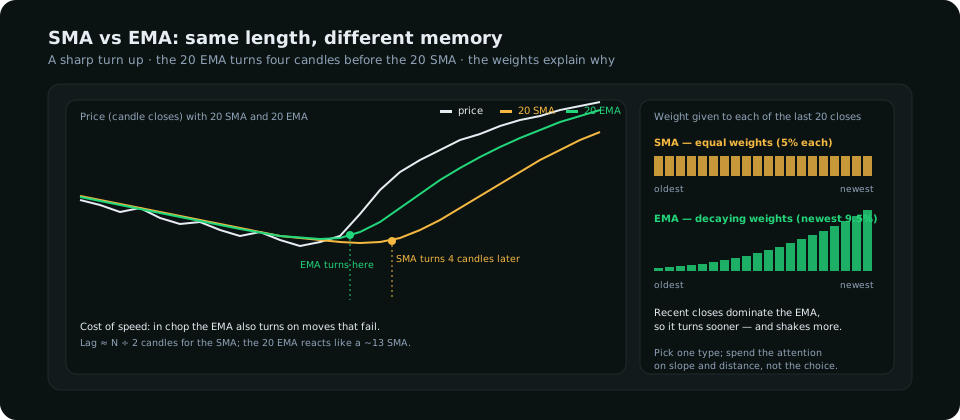
| Simple moving average (SMA) | Exponential moving average (EMA) | |
|---|---|---|
| Calculation | Arithmetic mean of the last N closes | Weighted mean; each close's weight decays geometrically, newest heaviest |
| Lag | About N ÷ 2 candles | Less — the 20 EMA reacts like a 13-period SMA |
| Noise | Smoother; false turns rarer | Twitchier; more false turns in chop |
| Typical use | Long-term bias (50, 100, 200 on the daily) | Short-term direction and dynamic support (8, 20, 50 intraday) |
The choice matters less than traders argue about. On the same chart the 20 EMA and the 20 SMA sit within a few pips of each other most of the time and separate only at turns, where the EMA is a candle or two earlier and occasionally wrong. Pick one type, keep it, and spend the attention on what the line is doing.
What to read: slope, distance, then crossovers
Slope — the direction of the last N periods
A rising moving average means the average of the last N closes is higher than it was a candle ago; it is a trend statement with a built-in lookback. The slope of the 50 EMA on the 4-hour chart is a reasonable one-glance answer to "which way has this pair been going for the last ten days". A flat moving average is equally informative: it says there has been no net direction over the window, and in that condition every signal the average produces is noise.
Distance — how stretched price is from its average
Price far above a rising average is an extended trend, not a buy. The distance, measured in ATR, tells you whether an entry is chasing: more than two ATRs above the 20 EMA on the timeframe you trade and the next move is more often a pullback to the average than a continuation. The pullback to a rising average is the classic trend entry — but it is the pullback plus a trigger at a level, not the touch of the line, that makes the trade. The break of structure guide covers the trigger side.
Crossovers — the most quoted signal and the weakest
A fast average crossing a slow one (the 50 crossing the 200 is the "golden cross") confirms that a trend has already been running long enough for both averages to turn. It is a late confirmation, not an early signal. In a trending market the cross happens once and is right; in a ranging market it happens five times and is wrong four of them. Crossovers earn in roughly a third of market conditions and lose in the rest, which is why a trader who uses them needs a filter that says which condition the market is in.
Settings by timeframe
| Timeframe | Common settings | What they represent |
|---|---|---|
| Daily | 50 SMA, 200 SMA | Ten weeks and ten months of closes; the broad bias and the levels funds watch |
| 4-hour | 20 EMA, 50 EMA | About three and eight days; swing direction and the pullback zone |
| 1-hour | 20 EMA | One trading day; intraday direction |
| 15-minute | 8 EMA, 21 EMA | The last two and five hours; momentum within a session |
None of these numbers is magic; they are round and widely used, which is itself a mild reason to prefer them — a level many traders watch tends to produce reactions. The 200-day in particular is quoted in bank research and news, so price reaching it brings orders. The trend indicator comparison sets moving averages beside ADX and others for the same job.
Where moving averages fail
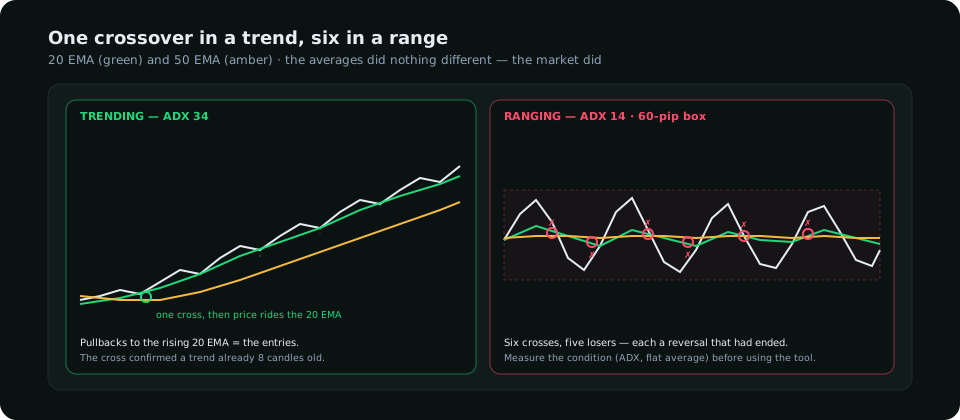
Ranges
In a range, price oscillates around its own average. Every crossover is a reversal that has already ended, every "dynamic support" touch is a coin flip. The fix is to measure the condition before using the tool: ADX below 20, or the average flat with price crossing it repeatedly, means the moving average has nothing to say. Trade the range edges instead — the strategy guide explains why the method has to match the regime.
Turns
A moving average cannot see a top or bottom until price has already moved far enough to drag the average around, by construction half its length late. The daily 200 SMA turns down about three months after the top. Traders who want earlier turn signals need structure (a lower high and a break of the last higher low) or positioning (speculators at an extreme — see COT extremes), not a shorter average, which just adds noise.
A sensible way to use one
- One average per timeframe, chosen once. The 50 EMA on the 4-hour chart is enough for most swing plans.
- Read slope first. Rising and price above: look for longs on pullbacks. Falling and price below: shorts. Flat: step aside or trade the range.
- Read distance second. More than two ATRs from the average is a pullback waiting to happen, not an entry.
- Enter on structure, not on the line. The average locates the area; a sweep or a break of structure on a lower timeframe is the trigger.
- Never size or stop by the average. The stop goes beyond the structure that defines the trade (the stop-loss guide); size follows from the stop.
Frequently asked
Which moving average is best for forex?
There is no best. The 20 and 50 EMA on the 4-hour and the 200 SMA on the daily are the most watched, which makes them the most useful as reference levels. The reading method matters more than the setting.
Is the EMA better than the SMA?
The EMA turns earlier and whipsaws more; the SMA turns later and whipsaws less. For intraday direction the EMA's speed is worth the noise; for the daily bias the SMA's calm is worth the lag.
Do moving averages work as support and resistance?
Only in a trend, and only because enough traders watch the same line to place orders near it. In a range the line passes through price without effect.
Everything on SMC Terminal is analysis and education, not a recommendation to buy or sell. Settings and thresholds are typical values for illustration. Trading carries a substantial risk of loss. Manage your risk.