Best Forex Indicators: What Each Measures and When to Use It
There is no best forex indicator — there are indicators that measure trend, momentum, volatility and volume, and traders who use the wrong one for the question they are asking. Here is what each family actually measures, when it helps, and when it lies.
Every indicator is a calculation on past price. None of them know the future, and most of them know the same thing. The reason so many traders own a chart with seven indicators and no edge is that five of those seven measure the same quantity in slightly different clothes. Pick one tool per question and the chart gets quieter and more honest.
This guide sorts the common forex indicators by the question they answer — which way, how fast, how far, how much conviction — and says plainly where each one breaks.
The four questions an indicator can answer
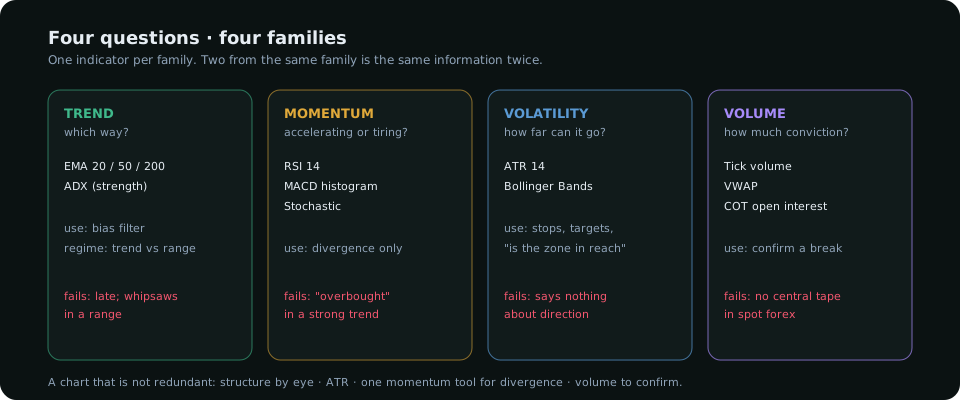
Trend: which way is the market leaning?
Moving averages (SMA, EMA) smooth price so the direction is readable. The 20 EMA tracks the swing trend, the 50 the intermediate, the 200 the position of price in its long-term range. They answer "which way" well and "when" badly — a crossover confirms a trend after a third of it has happened. Use them as a filter (only buy above the 50, only sell below), never as a trigger.
ADX measures trend strength without direction: above 25 the market is trending, below 20 it is ranging. Its value is in telling you which type of setup to look for, not where to enter.
Failure mode: every trend indicator is late by construction and whipsaws in a range. If ADX is under 20, turn the moving averages off.
Momentum: is the move accelerating or tiring?
RSI (14) compares recent gains with recent losses on a 0–100 scale. Above 70 and below 30 are the famous "overbought / oversold" levels, and they are the most misused numbers in retail trading: in a strong trend RSI sits above 70 for weeks while price keeps rising. The useful RSI signal is divergence — price makes a new high and RSI does not — which says the move is tiring, not that it has ended.
MACD is the difference between two EMAs with a signal line and a histogram. It is a trend indicator wearing a momentum badge: it tells you when the short average is pulling away from the long one. Read the histogram for acceleration; ignore the crossover as an entry.
Stochastic measures where the close sits in the recent range. It turns faster than RSI and lies more often; useful in a confirmed range, dangerous in a trend.
Failure mode: momentum oscillators were designed for ranges and are worst at the moment a trend begins — exactly when a trader most wants a signal.
Volatility: how far can price reasonably move?
ATR (Average True Range) is the most useful number on a forex chart and the least glamorous. It is the average size of a candle over the last 14 periods, in pips. It tells you where a stop has to sit to survive noise (1.5–2 × ATR beyond the level for a swing trade), how far a day can reasonably travel (one daily ATR is a full day's work), and whether a zone is "close" or "far" in terms that mean something. The terminal uses ATR for exactly these jobs: zones are defined by moves of at least 1.5 ATR; the area of interest must be within 4 ATR of price to count as actionable.
Bollinger Bands draw two standard deviations around a 20 SMA. Band width shows volatility contracting (a squeeze before a move) or expanding (the move). Price touching a band is not a signal; a close outside the band in a trend is continuation, not reversal.
Failure mode: volatility indicators say nothing about direction. Traders who buy a lower-band touch "because it's oversold" are using a volatility tool to answer a momentum question.
Volume: how much conviction is behind the move?
Spot forex has no central tape, so platform "volume" is tick count from your broker's feed. It is still useful as a relative measure — a breakout on three times the usual activity is different from one on a third of it. VWAP (volume-weighted average price) marks the average price institutions paid during the session; price above it means buyers are in control for the day. On futures (and for the currencies, in the CFTC's weekly report) real volume and open interest exist, and they are the better conviction read. Our COT report guide covers that side.
A comparison, by job
| Indicator | Measures | Use it for | Not for |
|---|---|---|---|
| EMA 20 / 50 / 200 | Direction, smoothed | Bias filter | Entries |
| ADX | Trend strength | Trend vs range regime | Direction |
| RSI | Speed of gains vs losses | Divergence in a trend | "Overbought = sell" |
| MACD | EMA spread and its change | Acceleration | Crossover entries |
| ATR | Average candle size | Stops, targets, reach | Direction |
| Bollinger Bands | Deviation around the mean | Squeeze → expansion | Band-touch reversals |
| VWAP / volume | Participation | Confirming a break | Timing |
How to build a chart that is not redundant
- Decide direction from structure (higher highs and lows or lower ones) on the higher timeframe. If you want help, one moving average as a filter.
- Put ATR on every chart. It sizes your stop and tells you whether a level is reachable.
- Choose one momentum tool, used only for divergence, and only in the direction of the structure.
- Use volume or VWAP to confirm a break, never to anticipate one.
That is three indicators and one skill. The skill — reading structure, liquidity and the levels where stops sit — is what the indicators were always approximating. Our Smart Money Concepts guide is the place to learn it, and TradingView Indicators covers setting the same chart up on the platform most traders use.
Everything on SMC Terminal is analysis and education, not a recommendation to buy or sell. Manage your risk.