Forex Drawdown Explained: How Losses Affect Account Recovery
A forex drawdown is the distance from the account's last peak to its current trough, and its arithmetic is unforgiving: the gain needed to recover grows faster than the loss that caused it. This guide explains the three measures of drawdown that matter, the recovery table every trader should know by heart, how drawdown depth is set by risk per trade and losing streaks, and the rules that stop a normal drawdown from becoming a terminal one.
A forex drawdown is the decline from an account's highest point to its lowest point before a new high is made, and it is the number that ends trading careers, not the win rate or the strategy. The reason is arithmetic: a loss and the gain needed to undo it are not symmetric. Lose 10% and you need 11% back; lose 30% and you need 43%; lose 50% and you need to double the account. Every trader knows this in the abstract and most discover it in practice at a size they cannot climb out of. This guide covers the measures of drawdown, the recovery table, what decides how deep a normal drawdown goes, and the rules that keep one from becoming permanent.
Three measures
| Measure | Definition | What it tells you |
|---|---|---|
| Maximum drawdown | The largest peak-to-trough decline over the whole record | The worst the strategy has done; the number a prop firm or investor asks for |
| Current drawdown | Distance from the last equity high to now | Where you are in the cycle; what the recovery requires today |
| Relative drawdown | Current drawdown as a share of the peak, often measured on closed equity | The comparable figure across account sizes; what prop-firm limits are set on |
Two refinements matter. Duration: the time from the peak to the new high, the underwater period, is often more damaging psychologically than the depth, and strategies with modest 12% drawdowns that last eight months lose more traders than ones with 20% drawdowns that recover in six weeks. And drawdown in R, measured in units of risk per trade rather than percent, is the strategy's own property; the percent version is that property multiplied by the risk you chose. A strategy with a maximum drawdown of 12 R is a 12% drawdown at 1% risk and a 36% drawdown at 3%.
The recovery table
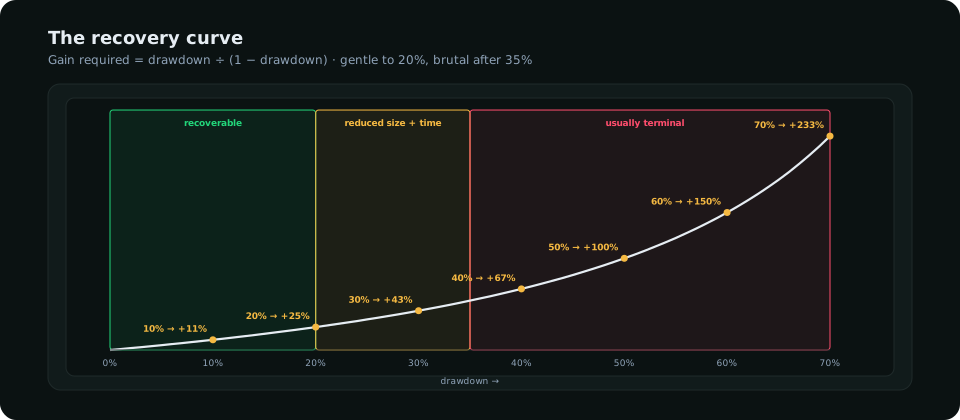
The formula is simple: the gain required to recover a drawdown d is d ÷ (1 − d). The consequence is that drawdowns below 20% are an ordinary cost of trading, drawdowns between 20% and 35% are recoverable only by a trader who keeps doing exactly what worked before at reduced size, and drawdowns above 35% are usually terminal, not because the arithmetic forbids recovery but because the trader at −40% almost never trades the way the trader at 0% did. Size goes up to "get it back", rules get bent, and the drawdown deepens. The practical goal of risk management is to make 35% unreachable.
What decides the depth
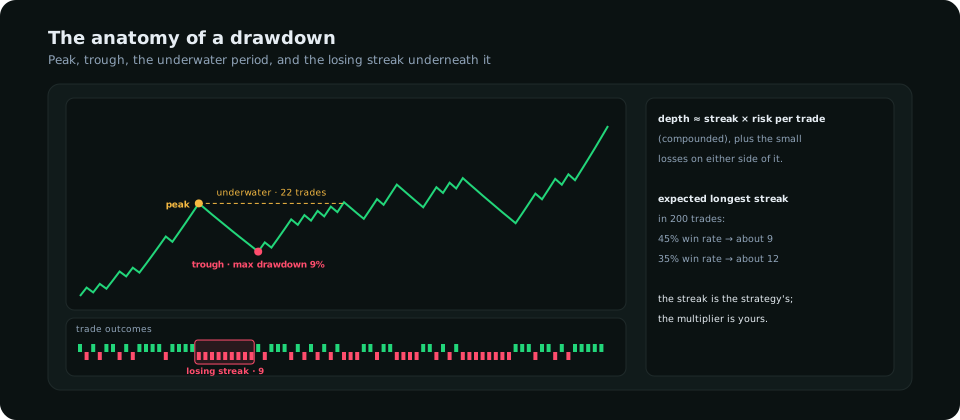
A drawdown's depth is approximately the longest losing streak multiplied by the risk per trade, compounded, plus whatever partial losses surround it. The streak is a property of the win rate: over 200 trades at a 45% win rate, a streak of nine or ten losses is expected, not unlucky; at 55% it is seven or eight; at 35% (common for trend strategies with large winners) it is twelve or more. Multiply by the risk per trade and the expected maximum drawdown falls out: nine losses at 1% is about 9%, at 2% about 17%, at 3% about 24%. The risk per trade guide works through the same arithmetic from the other side; the win rate article covers where the streak length comes from.
Rules inside a drawdown
- Size is a percentage of current equity, recalculated after every closed trade. The position shrinks as the account does, which slows the descent automatically. This single rule turns a 9-loss streak at 2% from −18% into −16.6% and, more importantly, keeps the next loss smaller than the last.
- Halve the risk at a threshold. At −10% (or whatever your monthly limit is), halve the risk per trade until the equity high is recovered. Recovery is slower in calendar time and far more likely to happen.
- Do not change the strategy. A drawdown inside the expected range (the streak the win rate predicts) is not evidence the strategy is broken. Changing it mid-drawdown replaces a known edge in a bad patch with an unknown one.
- Do change the strategy if the drawdown exceeds the expected range. A 20 R drawdown on a strategy whose worst backtested streak was 10 R is evidence; stop, and review the trades for a rule that is no longer being followed or a market that has changed.
- Stop at the day and week limits. Most catastrophic drawdowns are not one streak but one bad day traded on, then one bad week. The risk management guide sets the limits.
A worked recovery
A 10,000-dollar account at 1% risk hits a nine-loss streak with two small winners inside it: equity 9,150, a drawdown of 8.5%. Rule two does not trigger (the threshold is 10%), so risk stays at 1% of current equity, which is now 91.50 per trade. The strategy's expectancy is 0.3 R per trade. Recovery needs 850 dollars, which is about 9.3 R, which at 0.3 R per trade is roughly 31 trades, or six to eight weeks at the strategy's frequency. That is a normal underwater period and the correct response to it is to keep trading the plan. The same streak at 3% risk would have produced a 24% drawdown needing 32% to recover; at 0.3 R per trade on a shrunken base that is over a hundred trades, most of a year, and the trader who started at 3% is rarely patient enough to get there.
Drawdown and prop-firm accounts
Funded accounts impose relative drawdown limits (commonly 5% daily and 10% overall), sometimes trailing from the equity high including open profit. Under those rules the expected streak at 1% risk already threatens the overall limit, which is why evaluations are usually traded at 0.25–0.5% risk per trade: the trader is not maximising return but minimising the probability of a 10% drawdown inside the evaluation period. The position size guide converts those percentages into lots for a given stop.
Frequently asked
What is an acceptable drawdown in forex?
Under 20% for a discretionary trader, and ideally under 12%. The number is set by the risk per trade: at 1% risk with a normal win rate, 10–15% is the expected worst case and anything beyond it is a signal to review.
How do I recover from a forex drawdown?
Keep trading the same strategy at a reduced percentage of the smaller equity, and let the expectancy do the work over the number of trades it needs. Increasing size to recover faster is how a recoverable drawdown becomes a terminal one.
How is maximum drawdown calculated?
For every point on the equity curve, the decline from the highest prior equity; the maximum drawdown is the largest of those declines, expressed as a percentage of that prior high. Most platforms and journals report it; it is worth computing in R as well as percent.
Everything on SMC Terminal is analysis and education, not a recommendation to buy or sell. Figures in the example are illustrative. Trading carries a substantial risk of loss. Manage your risk.