How to Analyse Gold Prices Using Charts and Macroeconomic Data
Gold price analysis that holds up combines two things most traders keep apart: the macro drivers that set gold's direction over weeks (real yields, the dollar, central-bank buying, positioning) and the chart structure that times it. This guide lays out both halves, the order to read them in, and a weekly checklist.
Gold has no earnings, no coupon and no central bank setting its rate, so its price is set by a tug-of-war between a handful of macro forces and the positioning of the people trading them. That makes gold price analysis a two-layer job. The macro layer says which way the pressure is pointing over the coming weeks; the chart layer says where, within that, the market is likely to turn and when. Reading only the chart produces trades against the tide; reading only the macro produces the right idea at the wrong price. This guide sets out both layers, the order to read them in, and the weekly routine that keeps them current.
Layer one: the macro drivers, ranked
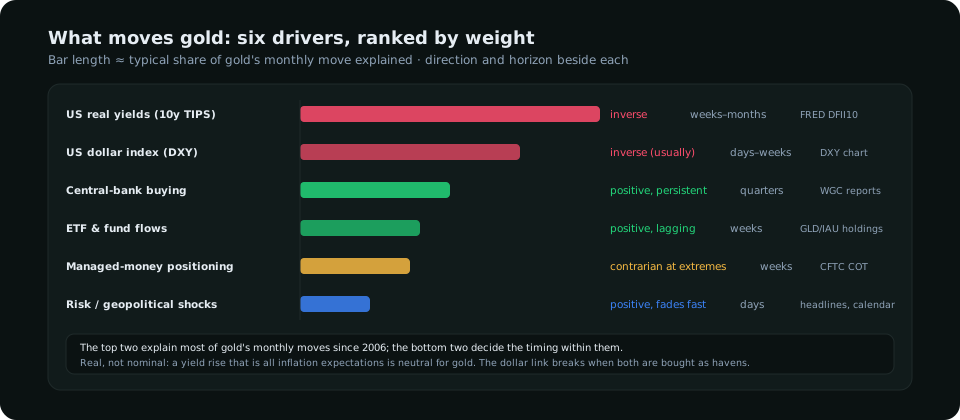
| Driver | Effect on gold | Horizon | Where to read it |
|---|---|---|---|
| US real yields (10-year TIPS yield) | Inverse: higher real yields raise the cost of holding a non-yielding asset | Weeks to months | FRED series DFII10; the daily move in real yields is the single best one-line explanation of gold's day |
| US dollar index (DXY) | Inverse most of the time; gold is priced in dollars | Days to weeks | The DXY chart; the correlation article covers when it breaks |
| Central-bank buying | Positive and persistent; a structural bid since 2022 | Quarters | World Gold Council quarterly demand reports |
| ETF and fund flows | Positive; Western investor demand follows the real-yield signal with a lag | Weeks | GLD/IAU holdings, published daily |
| Managed-money positioning | Contrarian at extremes; a crowded long is fuel for a sell-off | Weeks | The CFTC disaggregated report — see gold through the COT report |
| Risk and geopolitics | Positive on shocks; fades fast unless yields follow | Days | Headlines; the calendar for scheduled events |
Two refinements matter. First, it is real yields, not nominal: a rise in the 10-year Treasury yield driven by higher inflation expectations is neutral to positive for gold, while the same rise driven by higher real rates is negative. Second, the dollar relationship is a rule of thumb, not a law — gold and the dollar have risen together for long stretches when both were bid as havens, and when central banks outside the US were the marginal buyer. The Treasury yields article works through the transmission in detail.
Layer two: the chart
With the macro direction in hand, the chart answers "from where" and "when". Gold respects structure as cleanly as any market: swing highs and lows on the daily, breaks of structure on the 4-hour, and sweeps of obvious levels before the real move. Three chart tools earn their place:
- Daily structure for the trend state. Higher highs and higher lows with the macro layer bullish is the easy regime; a daily change of character against a still-bullish macro is the warning that positioning, not fundamentals, is driving.
- Round numbers and prior highs as liquidity. Gold's stops cluster at $50 increments and at the previous week's high and low; the sweep of those levels before a reversal is a reliable trigger. The XAUUSD structure guide covers the levels in detail.
- ATR for distance. Gold's daily range is $30–60 in a normal regime and over $100 in a stressed one; stops and targets in dollars that ignore this are wrong half the year. The ATR guide shows the calculation.
Reading the two layers together
The layers agree most of the time, and when they do the trade is straightforward: macro bullish, daily uptrend, buy the pullback to a 4-hour demand level after a sweep. The information is in the disagreements:
| Macro layer | Chart layer | What it usually means | Response |
|---|---|---|---|
| Bullish (real yields falling) | Uptrend | Aligned | Trade with the trend from pullbacks |
| Bullish | Daily CHoCH, sell-off | Positioning unwind: longs were crowded | Wait; the macro bid returns once the COT index resets |
| Bearish (real yields rising) | Uptrend persists | A non-rate buyer (central banks, risk hedging) is dominant | Respect the chart; size down; the macro headwind caps upside |
| Bearish | Downtrend | Aligned | Sell rallies into supply |
| Mixed | Range | No dominant driver | Range edges only, or stand aside |
The weekly checklist
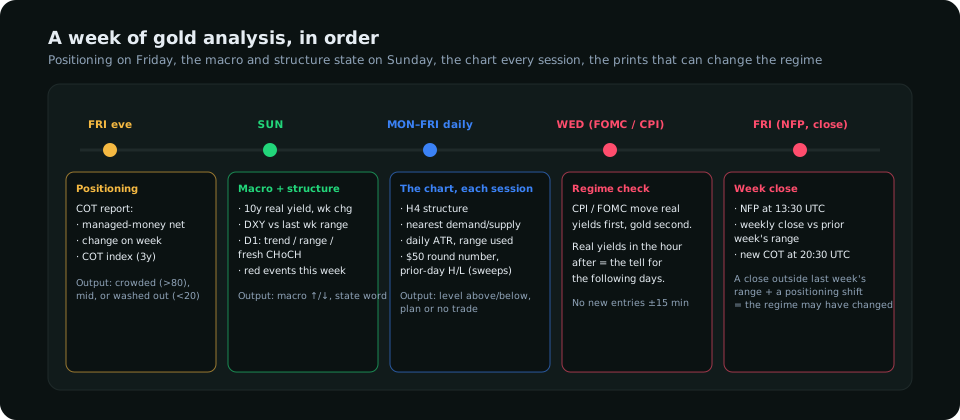
- Friday evening — positioning. The CFTC report: managed-money net long in contracts, the change on the week, and where it sits in its three-year range (the COT index). Above 80 is crowded; below 20 is washed out.
- Sunday — the macro state. The 10-year real yield's weekly change and direction; DXY's weekly close against the prior week's range; the daily structure (trend, range, or a fresh CHoCH); the week's red calendar events.
- Every session — the chart. 4-hour structure, the nearest demand and supply, the daily ATR and how much of it today has used, the round number and prior-day high and low as sweep candidates.
- Around prints — the regime check. CPI, FOMC and nonfarm payrolls move real yields first and gold second; the direction of real yields in the hour after the print is the tell for the following days.
Common mistakes
Treating a headline as a driver. A geopolitical shock lifts gold for a day; if real yields do not fall, the move retraces. Reading nominal yields. A 20 basis-point rise in the 10-year that is all inflation expectations is not bearish gold. Ignoring positioning. The most violent gold sell-offs happen with the macro still bullish, because the longs were already in. Fixed-dollar stops. A $15 stop that was fine at an ATR of $30 is noise at an ATR of $80. The XAUUSD strategy turns these reads into a rules chain, and SMC Terminal's Symbol Analysis composes positioning, seasonality, valuation and the macro regime into one gold verdict every day.
Frequently asked
What is the most important indicator for gold?
The 10-year real yield. Over months it explains more of gold's direction than any chart indicator; the chart then times entries inside that direction.
Does gold always fall when the dollar rises?
No. The inverse relationship holds on most days but breaks for weeks at a time when both are bought as havens or when non-dollar buyers dominate. Check real yields when the correlation looks wrong.
How far ahead can gold be forecast?
Direction over weeks, from the macro layer, with moderate confidence. Levels over days, from the chart. Exact prices on exact dates, by no method.
Everything on SMC Terminal is analysis and education, not a recommendation to buy or sell. Ranges and thresholds are typical values for illustration. Trading carries a substantial risk of loss. Manage your risk.