XAUUSD Trading Strategy: A Rules-Based Approach to Gold Analysis
Gold punishes traders who treat it like a currency pair. This XAUUSD strategy runs the analysis in a fixed order — macro direction, positioning, seasonal window, structure, then execution inside the sessions that move gold — with a written rule at each step and the sizing gold's volatility demands.
Gold is the most popular instrument among retail traders and the one that empties the most accounts. The two facts are related. XAUUSD moves like a currency pair on the chart but is driven like a bond on the inside, and its hourly range is routinely ten times EUR/USD's. A strategy that works on it has to respect both halves: analyse it as a macro instrument, execute it as a volatile one.
What follows is a complete XAUUSD trading strategy written as rules. The order of the steps is part of the strategy; running step five before step one is how gold traders end up short at 4,150 with "a great setup" and no idea why price went to 4,250. For the background on what drives the metal, the gold trading guide covers it; this article is the method.
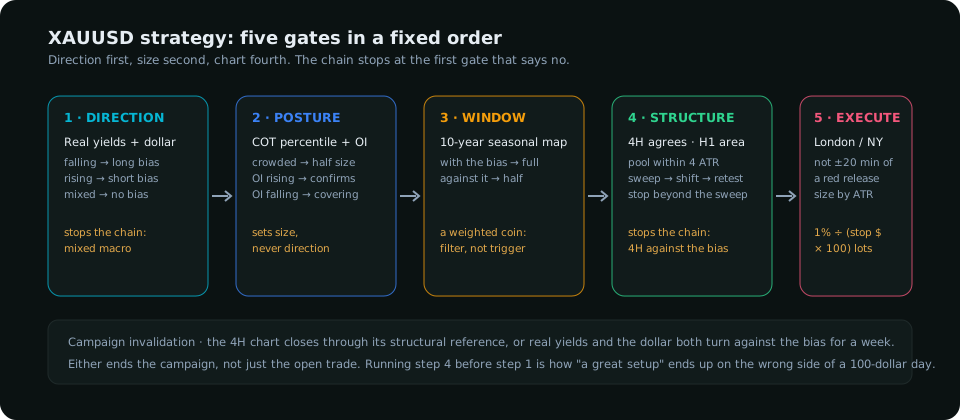
Step 1 — Direction from the macro pair
Gold's direction over weeks is set by two series: the real yield on US 10-year Treasuries and the dollar index. Rising real yields and a rising dollar are a headwind; falling ones a tailwind. The rule:
- Long bias only when the 10-year real yield is below its level of four weeks ago or the dollar index is below its 50-day average, and neither is rising sharply.
- Short bias only when both are rising.
- Mixed → no directional bias; gold is traded range-to-range or not at all.
The dollar index is the easier of the two to watch intraday; the real yield changes slowly and is checked once a day. A research terminal composes these into a bias score; done by hand it is two charts and five minutes.
Step 2 — Posture from positioning
Gold futures speculators are trend followers, and the CFTC's weekly report tells you how crowded they are. The rule is about size, not direction — direction is already decided.
- Net speculative long in the top 10% of its three-year range → long trades at half size; shorts at full size if step 1 allows them.
- Bottom 10% → the mirror.
- Open interest rising with price confirms the move is being paid for; price rising on falling open interest is short covering and gets half size regardless.
The COT report for forex and the COT index formula explain how to compute the percentile; a terminal shows it as a number.
Step 3 — The seasonal window
Gold has a documented seasonal shape: firmer from late summer into the first quarter, softer from spring into mid-summer, with a hit rate around 65–70% over ten years in the strongest weeks. The rule treats it as a filter, never a trigger: a long bias in a seasonally strong week gets full size; against the window, half size. A seasonal window is a weighted coin, and a weighted coin is worth a position-size adjustment and nothing more.
Step 4 — Structure on the 4-hour and hourly charts
Now, and only now, the chart. On the 4-hour chart, label the swings and confirm the structure agrees with the bias: higher highs and higher lows for a long. If it does not, the bias is early — wait for a change of character on the 4-hour chart before taking any entry. On the hourly chart, mark the area to trade from: the nearest pool of liquidity against the direction (equal lows, the previous day's low, the Asian session low) and the demand zone just beyond it, within four hourly ATRs. Then the sequence from the SMC strategy: sweep, shift, retest. The entry is the retest; the stop is beyond the sweep; the first target is the opposite pool; the second is the 4-hour swing.
Step 5 — Execution inside the sessions that move gold
Gold trades almost 24 hours but moves in three windows. Triggers only count inside them:
| Window (New York time) | What usually happens | Rule |
|---|---|---|
| London 02:00–05:00 | The Asian range is run, the day's first direction set | Full set of entries allowed |
| New York 07:00–10:00 | US data at 08:30; the largest ranges of the day | No entries 20 minutes either side of a red-folder release |
| Late New York 13:00–15:00 | The futures close at 13:30 NY; options and settlement flows | Entries allowed; expect reversals of the morning move |
| Asia 20:00–00:00 | Range-building, Shanghai open flows | No new entries; manage open positions |
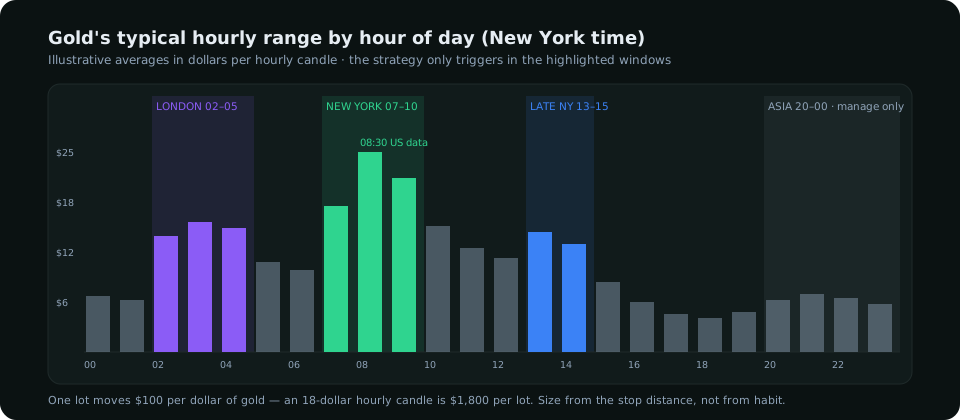
Sizing: the step most gold traders skip
Gold's hourly ATR is routinely 12–18 dollars and 25 or more on a US data day. One standard lot (100 ounces) moves $100 per dollar, so a stop one ATR beyond a sweep is a $1,200–$1,800 risk per lot. The rule: size = account risk ÷ (stop distance in dollars × 100), with account risk capped at 1% and the stop distance never less than one hourly ATR. A $10,000 account risking $100 with a $15 stop trades 0.067 lots — under seven ounces. Traders who size gold like EUR/USD are using ten times the risk they think they are. The full method is in forex risk management; the figures above are the gold-specific numbers.
The strategy on one card
- Direction: real yields and the dollar. Mixed → no bias.
- Posture: COT percentile and open interest set the size.
- Window: seasonal strength sets the size again.
- Structure: 4-hour agrees; hourly area marked; sweep → shift → retest.
- Execution: inside London or New York, away from releases, sized by ATR.
Invalidation at every level: the 4-hour chart closes through its structural reference (step 4 fails), or the dollar and real yields both turn against the bias for a week (step 1 fails). Either one ends the campaign, not just the trade.
What this strategy will not do
It will not catch the geopolitical spike — by the time the headline is on your feed the move is done, and the strategy's entry, if any, is the retrace into the zone the spike left. It will not short gold for weeks against a structural central-bank bid; shorts are hours to days. And it will not trade every day. In a mixed macro month it may produce three trades. That is not a weakness. The gold traders who last are the ones who learned to want fewer, better-paid moves rather than daily action on the most volatile chart in retail trading.
Everything on SMC Terminal is analysis and education, not a recommendation to buy or sell. Prices, ranges and percentiles are illustrative; check current data before acting. Gold is a high-volatility instrument and trading it carries a substantial risk of loss. Manage your risk.