SMC Trading Strategy: Market Structure, Liquidity and Entry Confirmation
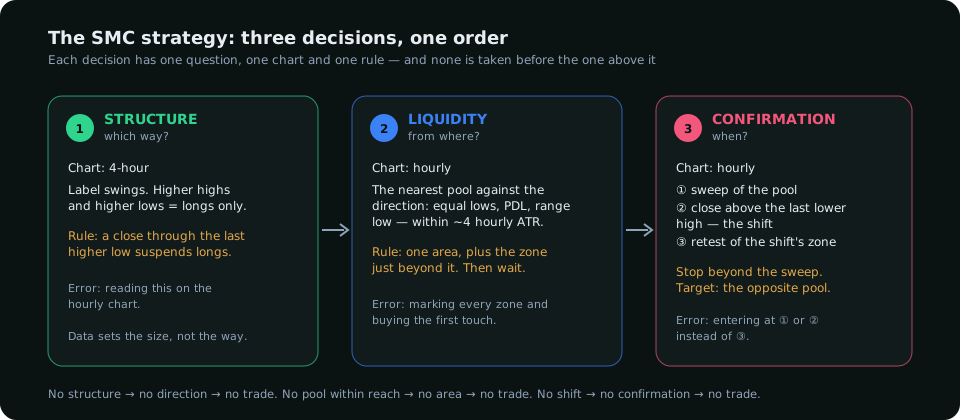
A Smart Money Concepts strategy is three decisions in a fixed order: which way (structure), from where (liquidity) and when (confirmation). This tutorial builds the strategy step by step, with the rules for each decision, the common ways each one goes wrong, and a worked example from the hourly chart.
Smart Money Concepts is usually taught as a vocabulary — order blocks, fair value gaps, breaks of structure, liquidity sweeps — and traders come away able to label a chart but not to trade it. A strategy is different from a vocabulary. It is a fixed sequence of decisions with a rule for each one. The SMC strategy in this tutorial has three decisions, taken in order and never out of it: structure decides the direction, liquidity decides the area, and confirmation decides the moment. If any one of the three is missing, there is no trade.
If the terms are new, read the practical SMC guide first. This article assumes the vocabulary and builds the method.
Decision 1 — Structure: which way
On the 4-hour chart, label the swing highs and lows. An uptrend is a sequence of higher highs and higher lows; a downtrend the reverse. The last confirmed swing in the direction of the trend is the structural reference: for an uptrend, the last higher low. The direction rule is simple and non-negotiable:
- You may only look for longs while the 4-hour chart holds its last higher low.
- You may only look for shorts while it holds its last lower high.
- A close through the reference is a change of character: the old direction is suspended until a new structure forms. Not reversed — suspended. Sit out.
The common error is reading structure on the entry timeframe. The hourly chart changes character several times a week; the 4-hour chart does so a few times a month. Direction comes from the slower one. Where the pair's data disagrees with the chart — speculators at a record long while the 4-hour chart prints higher highs — the chart still decides direction for this strategy, but the positioning decides size: a trend the crowd is already all-in on gets half size.
Decision 2 — Liquidity: from where
With the direction fixed, the question is where the trade starts. The answer is always the same kind of place: a pool of resting orders on the opposite side of the direction you want to trade, because that is what a large participant needs to fill against.
- For a long: equal lows, a prior day's or week's low, or the low of a clear range below current price. These hold the stops of early longs and the entries of breakout shorts — a pool of sell orders that a buyer can fill into.
- For a short: the mirror — equal highs, a prior high, a range high.
Mark the nearest such pool within reach — roughly four hourly ATRs of current price. Beyond that it is a map, not a plan. If there is a demand zone (the last down candle before an impulse up) just beyond the pool, the two are one area: the sweep of the lows is expected to run into the zone and hold there. The order-block versus fair-value-gap comparison covers which kind of zone is worth marking.
The common error is marking every zone on the chart and buying the first one price touches. The rule here is one area, chosen because it has liquidity in front of it, and nothing happens until price reaches it.
Decision 3 — Confirmation: when
Price arriving at the area is not the entry. Price arriving, taking the pool and then proving that buyers have taken control is the entry. On the hourly chart the proof has three parts, in order:
- The sweep. A wick or a brief close through the pool — the stops are taken.
- The shift. A close back through the most recent hourly lower high (for a long). This is the structure shift: the hourly chart, which was making lower lows into the area, has now made a higher high. Without this, the sweep may simply be the start of a larger move down.
- The retest. Price returns to the zone that caused the shift — the last down candle before the impulse that broke the lower high — and holds. That is the entry: a limit at the top of that zone, or a market entry on the first bullish hourly close inside it.
The stop goes beyond the sweep low. The first target is the nearest pool in the trade direction — the opposite liquidity. The second is the 4-hour swing that defines the structure. The idea is invalid, before or after entry, if the hourly chart closes back below the sweep low: the shift was false.
The worked example
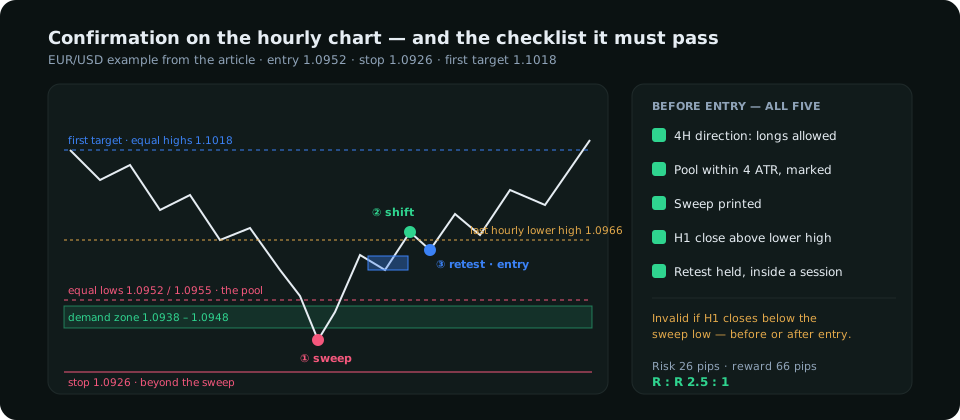
EUR/USD, 4-hour chart: higher high at 1.1040, higher low at 1.0925. Direction: long only. Below current price (1.0990) sit equal lows at 1.0952 and 1.0955 — a pool 35 pips away, within reach — with an hourly demand zone at 1.0938–1.0948 just under it. One area: 1.0938–1.0955.
Price falls, wicks to 1.0931 (the sweep), closes the hour at 1.0944 inside the zone. Two hours later it closes at 1.0971, above the last hourly lower high at 1.0966 — the shift. The impulse that made the shift started from a down candle spanning 1.0946–1.0953. Price retests 1.0950 and prints a bullish hourly close: entry 1.0952, stop 1.0926 (beyond the sweep), first target the equal highs at 1.1018, second target 1.1040. Risk 26 pips, first reward 66 pips: 2.5 to 1.
Note what the trader did not do: buy the first touch of the zone (no shift yet), buy the shift candle itself (no retest, worse price), or move the stop to the zone low (inside the sweep's range, where it would have been taken by noise).
Where the strategy fails, and what to do about it
| Failure | Usual cause | Fix |
|---|---|---|
| Sweep with no shift; price keeps falling | Trading against the 4-hour direction, or the "pool" was not the last one | Decision 1 was wrong or skipped; no trade was ever valid |
| Shift, no retest; price runs without you | Normal — around a third of valid setups do this | Accept it. Chasing the missed retest is how the stop ends up at the wrong place |
| Retest holds, target not reached, reversal | Entry taken into a scheduled release or outside a session window | Add the session filter: triggers count only inside London or New York windows, never within 20 minutes of a red-folder release |
| Repeated small losses in a range | The 4-hour chart was ranging, which gives no direction | Decision 1 says sit out when there is no structure. Ranges are traded with a different method |
Keeping it a strategy
The method is three rules, and its edge comes from refusing to take two of them without the third. Write the five checklist conditions on a card, tick them for every trade, and keep the card with the trade record. After fifty trades the card tells you which condition you are skipping when you lose — in most traders' records it is the structure shift, taken on hope rather than on a close. That is the trade to stop taking.
Everything on SMC Terminal is analysis and education, not a recommendation to buy or sell. The example uses illustrative prices. Trading carries a substantial risk of loss. Manage your risk.