Gold Trading Guide: Market Drivers, Analysis and Risk Management
Gold is the most-traded metal and the least-understood chart. It is not a commodity, not a currency and not an inflation hedge in the way the headlines say. Here is what actually moves it, how to analyse it with data you can check, and how to size it so a 60-dollar hour does not end the account.
Gold has no cash flow, no earnings and no yield, which is why it confuses analysts trained on stocks and bonds. It has a price for one reason: people choose to hold it instead of something else. Trading it well means understanding what the "something else" is at any given time — and for most of the last two decades the answer has been a dollar earning a real interest rate.
This guide covers the drivers that actually explain gold's moves, the data you can use to analyse it, the sessions and structure that matter for execution, and the sizing that gold's volatility demands.
What really moves gold
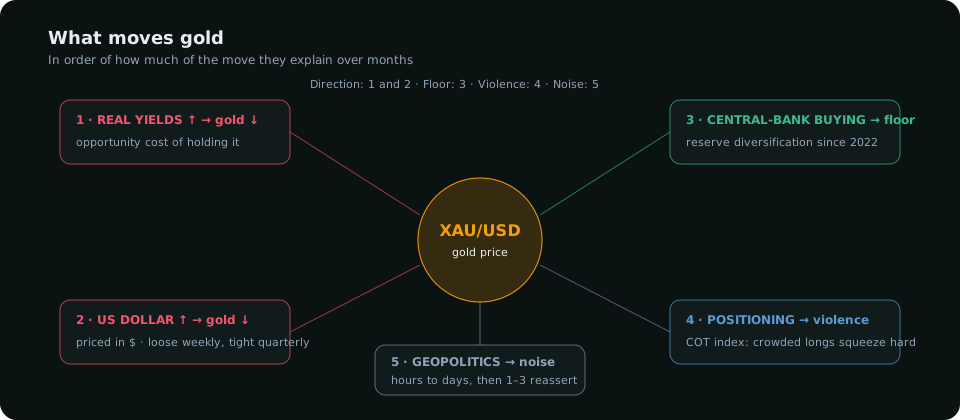
- Real yields. The yield on a US Treasury after inflation is the opportunity cost of holding gold. When real yields rise, gold tends to fall; when they fall — or markets expect them to — gold rises. This single series explained most of gold's swings from 2008 to 2022 and still sets the tone around every Federal Reserve meeting.
- The US dollar. Gold is priced in dollars, so a weaker dollar lifts it mechanically and a stronger one weighs on it. The relationship is loose week to week and tight over quarters.
- Central-bank buying. Since 2022 official reserve purchases — led by emerging-market central banks diversifying away from the dollar — have been the structural bid that let gold rise even while real yields were high. This is the driver that broke the old models, and it moves slowly.
- Positioning. Speculators in gold futures are trend followers: heavily long at highs, short at lows. The CFTC's weekly report shows how crowded they are; the COT index turns it into a 0–100 reading. Extremes do not time turns but they tell you which way the squeeze goes.
- Risk and geopolitics. Gold catches a bid in a crisis — for hours to days. Then the first three drivers reassert. Trading the headline is a way to buy the top of a spike.
The honest summary: real yields and the dollar set the direction, central banks set the floor, positioning sets the violence of the moves, and geopolitics sets the noise.
How to analyse gold with data you can check
- Direction from macro. Are real yields rising or falling? Is the dollar index trending? The terminal's Macro tab composes these into a bias per market; you can do it by hand from the 10-year TIPS yield and DXY.
- Posture from positioning. Speculator net, its week-over-week change, open interest and the index. Rising net with rising open interest is new buying; rising net with falling open interest is short covering and weaker.
- Season from the map. Gold has a documented seasonal shape — stronger into year-end and the first quarter, softer in mid-year — with a hit rate you should check rather than assume. Seasonality Is Not a Signal explains how to read it without being fooled.
- Structure for execution. On the 4-hour and hourly charts, label the swings, mark the zones and the liquidity, and wait for the sequence: sweep, shift, retest. Gold rewards this discipline more than most markets because its stops cluster at very obvious round numbers.
The sessions that matter for gold
Gold trades almost 24 hours, but three windows carry the moves. London (02:00–05:00 New York) sets the day's first direction and runs the Asia range. New York (07:00–10:00) brings the US data at 08:30 — CPI, payrolls, retail sales — and the COMEX open; most of gold's largest hourly candles print here. The London fix at 10:30 and 15:00 London time attracts institutional orders and can produce sharp, short-lived spikes. Asia is quieter unless Chinese or Indian physical demand is in the news.
A practical rule for a day trader: no entries in the twenty minutes before a red-folder US release, and treat the hour after one as its own session with its own structure.
Risk management: gold is not EUR/USD
Gold's hourly ATR is routinely 10 to 15 dollars; on a data day it is 25 or more. One standard lot (100 ounces) moves $100 per dollar of price, so a 15-dollar hourly candle is $1,500 per lot. Traders who size gold the way they size a currency pair blow up on an ordinary afternoon.
| Account | Risk per trade (1%) | Stop distance | Maximum size |
|---|---|---|---|
| $2,000 | $20 | $12 (≈ 1 ATR) | 0.016 lots (1.6 oz) |
| $10,000 | $100 | $12 | 0.08 lots (8 oz) |
| $50,000 | $500 | $18 (1.5 ATR) | 0.28 lots (28 oz) |
Size = risk ÷ (stop distance × value per dollar per lot). Put the stop beyond the sweep and the zone — one hourly ATR beyond the level is the minimum that survives noise — and let the stop distance decide the size, never the other way round. The full method is in Forex Risk Management.
Three mistakes specific to gold
- Trading it as an inflation hedge. Gold rose in 2020 when inflation was 1% and fell in 2022 when it was 9%, because real yields went the other way. Trade the real yield, not the CPI headline.
- Fading central-bank demand. Short-term shorts against a structural official bid have a poor record since 2022. If you are short gold, be short for hours, not weeks, unless the macro has actually turned.
- Chasing the geopolitical spike. The move is usually done by the time it is on your feed. The trade, if there is one, is the retrace into the zone the spike left behind.
Gold is a macro instrument executed with technical tools. Read it in that order — yields, dollar, reserves, positioning, then the chart — and it becomes one of the cleanest markets to trade.
Everything on SMC Terminal is analysis and education, not a recommendation to buy or sell. Trading carries a substantial risk of loss. Manage your risk.