Forex Win Rate vs Expectancy: How to Evaluate a Trading Strategy
A forex trading win rate on its own says almost nothing about whether a strategy makes money; a 40% win rate can be excellent and an 80% one can be ruinous. This guide explains the relationship between win rate and reward-to-risk, the breakeven line every strategy has to clear, how to calculate expectancy from a trade log, why the win rate also sets the losing streaks you will endure, and how to evaluate a strategy with the three numbers that actually predict its results.
The forex trading win rate is the first number traders quote and the least informative on its own. A strategy that wins 40% of the time with winners twice the size of losers makes money; one that wins 80% of the time with losers five times the size of winners loses it, slowly and then suddenly. The number that decides is expectancy: the average result per trade in units of risk, which combines the win rate with the size of wins and losses. This guide sets out the relationship, the breakeven line every strategy has to clear, how to compute expectancy from a log, the second thing the win rate controls (the losing streaks), and the three numbers that together say whether a strategy is worth trading.
Win rate and reward-to-risk are one trade-off
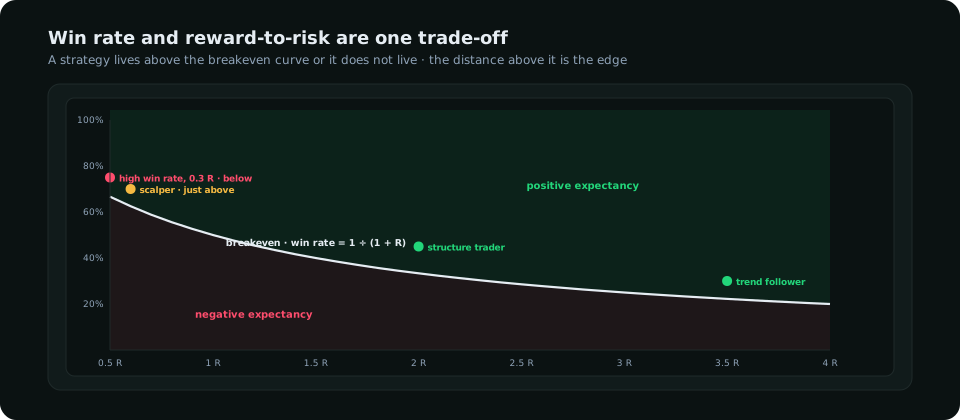
For a strategy whose average winner is R times its average loser, the win rate needed to break even is 1 ÷ (1 + R). At 1 : 1 that is 50%; at 2 : 1 it is 33%; at 0.5 : 1 it is 67%. Every strategy sits somewhere on this trade-off, and moving along it is free: tighten the target and the win rate rises while R falls; widen it and the reverse. What is not free is the distance above the line, which is the edge. A 55% win rate at 1 : 1 is five points above breakeven; a 45% win rate at 2 : 1 is twelve points above it. The second strategy is better despite the lower win rate, and the first is one bad month from a loss. The reward-to-risk guide covers how R is set by stop and target placement.
Expectancy from a trade log
Record every trade's result in R (profit or loss divided by the amount risked). Then expectancy = (win rate × average winning R) − (loss rate × average losing R). A log of 120 trades with 54 winners averaging +1.8 R and 66 losers averaging −0.9 R (some stopped early, some at full loss) gives 0.45 × 1.8 − 0.55 × 0.9 = 0.81 − 0.495 = 0.315 R per trade. That is the strategy's edge: on average each trade earns a third of the amount risked, so at 1% risk and 15 trades a month it produces roughly 4.7% a month before the variance around it. Realistic discretionary edges in liquid forex sit between 0.1 and 0.4 R; a log showing 1.0 R or more over a hundred trades usually has a counting error in it, as the backtesting guide explains.
Why high win rates hide the damage
| Strategy | Win rate | Avg win | Avg loss | Expectancy | What it feels like |
|---|---|---|---|---|---|
| Tight target, wide stop | 80% | +0.3 R | −1.5 R | −0.06 R | Winning for months; one week erases it |
| Scalping 1 : 1 | 55% | +1.0 R | −1.0 R | +0.10 R | Steady, small, fragile to costs |
| Structure trading 2 : 1 | 45% | +2.0 R | −0.95 R | +0.38 R | Losing weeks are normal; months are positive |
| Trend following 3.5 : 1 | 30% | +3.5 R | −1.0 R | +0.35 R | Long losing streaks; a few trades make the year |
The first row is the trap. An 80% win rate produces an equity curve that rises smoothly for months, a trader who believes the strategy works, and then a losing week that costs more than the preceding quarter earned. The average loss being five times the average win is visible in the log from the first week; the win rate conceals it from anyone who looks only at the win rate. Any strategy whose average loss is larger than its average win needs a win rate well above 60% just to break even after costs, and should be regarded with suspicion until a few hundred trades have shown it.
The second thing the win rate controls
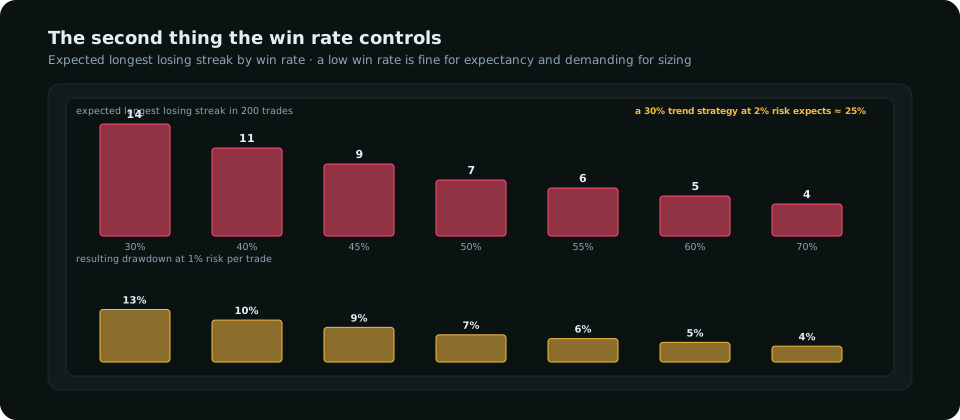
A low win rate with a high R is a legitimate edge, but it comes with long losing streaks: at a 30% win rate a run of twelve to fourteen losses in 200 trades is expected, and the trader has to be sized so that run is survivable and patient enough to sit through it. At 60% the expected streak is five. That is why the win rate still matters once expectancy is known: it sets the drawdown the strategy will produce at a given risk, and therefore the risk per trade it can bear. The risk per trade guide turns the streak into a sizing rule.
How many trades before you can trust the win rate
A win rate measured over 30 trades has a confidence interval of roughly ±18 points; over 100 trades, ±10; over 300, ±6. A strategy showing 55% after 30 trades might be a 40% strategy having a good month. Until a hundred trades are logged, treat the win rate as unknown and the risk per trade as provisional (0.5% or less). Between 100 and 300, trust the expectancy's sign but not its size. After 300, the three numbers below are stable enough to plan around.
The three-number scorecard
- Expectancy in R after costs: positive, and ideally above 0.2 R. This is whether the strategy makes money.
- Expected longest losing streak from the win rate: this, times the risk per trade, is the drawdown you have signed up for.
- Trades per month: expectancy times frequency is the return; a 0.5 R edge that fires twice a month earns less than a 0.2 R edge that fires twenty times.
A strategy with 0.3 R expectancy, a nine-loss expected streak and fifteen trades a month, traded at 1% risk, is worth about 4.5% a month with an expected worst drawdown around 10%. That is a good discretionary strategy, and it is a 45% win rate. The strategy selection guide covers how different styles land on different points of the trade-off; the scorecard is the same for all of them.
Frequently asked
What is a good win rate in forex?
Any win rate above the breakeven line for the strategy's reward-to-risk, with margin. 45% at 2 : 1 is good; 65% at 0.5 : 1 is not. The win rate is only meaningful next to the R.
Is a 50% win rate profitable?
At 1 : 1 it is breakeven before costs and losing after them. At 1.5 : 1 or better it is profitable. The ratio decides, not the rate.
How do I calculate expectancy?
Win rate × average win in R minus loss rate × average loss in R, from a log of at least a hundred trades with costs deducted. The result is the average R earned per trade.
Everything on SMC Terminal is analysis and education, not a recommendation to buy or sell. Figures in the example are illustrative. Trading carries a substantial risk of loss. Manage your risk.