Automated Forex Market Analysis: What Can Be Automated Reliably?
Automated forex analysis is sold as a replacement for the trader and works as a replacement for the trader's data entry. This guide sorts the analysis workflow into what automates reliably (collection, calculation, scheduling, alerting), what automates with supervision (structure reads, AI chart interpretation), and what does not (the decision), with the checks that tell you whether an automated read can be trusted on a given day.
Automated forex market analysis means different things at different ends of the sales funnel. At one end it is a script that downloads the COT report on Friday and computes the nets; at the other it is a promise that software will tell you what to buy. The first is boring and completely reliable; the second is exciting and does not exist. Between them is a spectrum, and the useful question is not whether analysis can be automated but which parts of it can be automated at what level of trust. This guide lays out that spectrum, describes how a reliable pipeline is built, and gives the checks a trader should apply before acting on any automated read, including the AI-generated ones that are now common.
The reliability spectrum
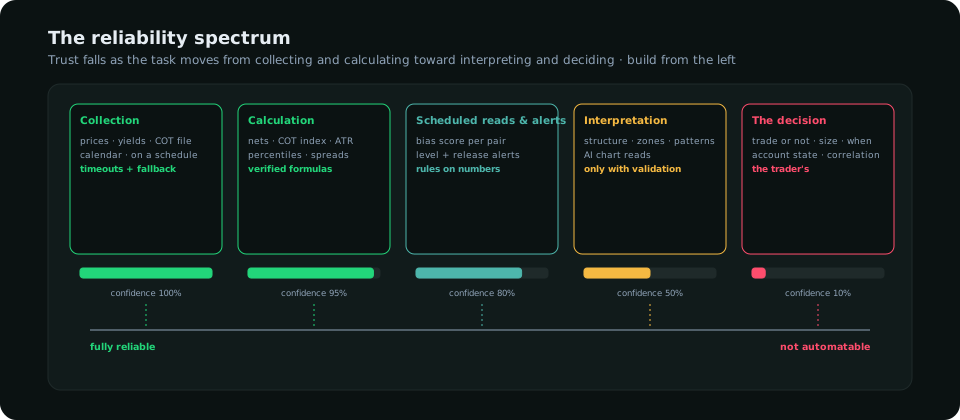
| Station | Examples | Reliability | Why |
|---|---|---|---|
| Collection | Prices, yields, the COT file, calendar events, fetched on schedule | Full, with timeouts and a fallback source | Deterministic; the only failures are network ones, which are detectable |
| Calculation | Nets and COT index, ATR, percentile ranks, spreads, session ranges, seasonality averages | Full, once the formula is verified | Arithmetic on known inputs; the same input always gives the same output |
| Scheduled reads and alerts | A bias score per pair from the calculations; alerts at levels, before releases, on COT changes | High | Rules applied to numbers; the rules can be wrong but they are consistent and inspectable |
| Interpretation | Structure detection, zone marking, pattern recognition, AI chart reads | Medium; high only with validation | Judgement on ambiguous data; good on clear charts, unreliable on messy ones, and must be checked against the candles |
| Decision | Trade or not, size, when | Not automatable for a discretionary trader | Depends on account state, correlation, the trader's own record and context no feed contains |
What automates reliably
Everything on the left half of the spectrum, and it is most of the work. Fetching the COT report every Friday, netting the groups, maintaining a 156-week window per market and computing the index is a job a script does identically every week and a human does differently every week; the COT guide describes the read, and the read is only possible once the arithmetic is automated. The same holds for yields and their changes, the ATR per pair, seasonal averages, session ranges, the calendar in your time zone and the composed bias score that combines them with fixed weights. The reliability conditions are mundane: every external fetch has a timeout and a fallback, a failed fetch keeps the previous value and says so, and each calculation has been checked once by hand against a known-good number. A pipeline built this way removes the Friday afternoon of data entry that causes most traders to abandon positioning analysis, and it does so without making a single judgement.
What automates with supervision
Interpretation is where automation becomes useful and dangerous at the same time. Structure detection (swing highs and lows, breaks of structure), zone marking and chart-pattern recognition can be coded, and the code is right on clean trending charts and wrong on choppy ones, which it cannot tell apart. AI models reading a chart image are a step up: they handle ambiguity better and can state a bias with reasons, levels with prices, a scenario with entry, stop and targets. They are also confident when wrong, and they will place a level where no candle has ever traded if nothing stops them. The condition for trusting an AI read is validation against the data: every price it names is checked against the actual candles, levels off the chart are dropped, a stop on the wrong side of the entry is rejected, the reward-to-risk is computed by the pipeline rather than taken from the model, and a scenario that fails any check is downgraded to no trade. That is how SMC Terminal's AI chart read is built: the model returns structured numbers, the terminal verifies every one of them against the candles and draws the chart itself, and a read that does not survive validation says NO TRADE rather than showing a setup. An AI read without that layer is an opinion with a confident tone.
What does not automate
The decision. Whether to take a valid setup depends on things no feed carries: how many correlated positions are already open, where the account is in its drawdown, whether the trader has traded this pair in this session before, whether the last three trades were taken with discipline. Signal services and bots that promise to automate the decision are automating a guess, as the trading signals guide sets out. The honest boundary: automation prepares the decision, fully and reliably, and the trader makes it.
How a reliable pipeline is built
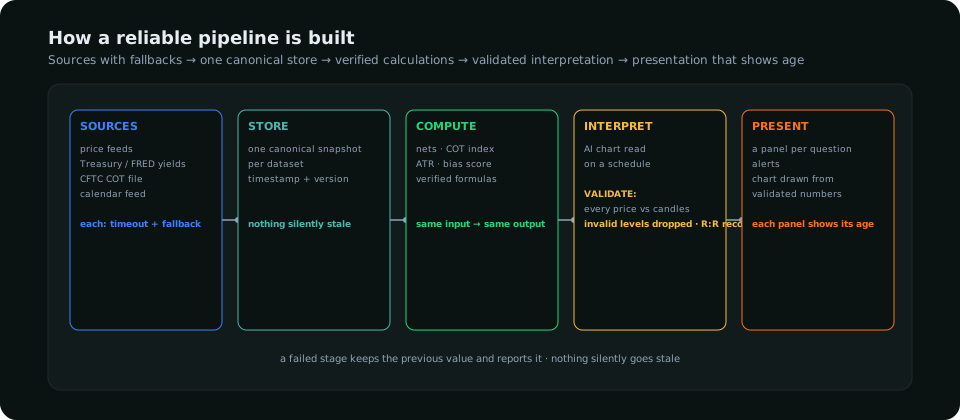
- Sources with timeouts and fallbacks. A feed that hangs is worse than one that fails; every fetch has a budget, and a second source stands behind the first for anything critical.
- One canonical store per dataset, with a timestamp and a version, so the dashboard never has to guess where a number came from or how old it is.
- Verified formulas. Each calculation checked once against a hand-computed value, then trusted.
- Interpretation behind validation. Any model output is checked against the data before it is stored; invalid parts are dropped and the dropping is logged.
- Presentation that shows age. Every panel says when its data was last refreshed; a stale panel is visibly stale.
Checks before acting on an automated read
- How old is it? A COT read from last Friday is current; a "live" bias composed from a yield feed that failed Tuesday is not.
- What did it drop? A validated AI read that discarded two levels and downgraded itself is being honest; one that never drops anything is not validating.
- Does the chart agree? Open the candles and confirm the structure the read describes exists. Thirty seconds, every time.
- Is a release inside the window? Automated reads rarely know that the number in forty minutes will make them obsolete.
- Is it the same as yesterday for no reason? A read that never changes is a read that is not updating.
The analysis tools comparison places automated pipelines among the other tool types, and the dashboard guide describes the panels a pipeline should feed.
Frequently asked
Can forex analysis be fully automated?
Collection, calculation, scheduled reads and alerts, yes. Interpretation, only behind validation against the data. The decision to trade, no, not for a discretionary trader, and not reliably for anyone selling it.
Are AI trading analysis tools reliable?
Reliable at describing a clear chart and stating levels, unreliable at knowing when the chart is not clear, and dangerous without a validation layer that checks every number against the candles. Ask any such tool what it drops and how; if the answer is nothing, that is the answer.
What is the best thing to automate first?
The COT processing. It is the most valuable analysis most traders skip, it is pure arithmetic, and automating it is what makes the positioning lens usable every week instead of occasionally.
Everything on SMC Terminal is analysis and education, not a recommendation to buy or sell. Figures in the example are illustrative. Trading carries a substantial risk of loss. Manage your risk.