How to Use a Forex Strategy Tester to Evaluate Trading Rules
A forex strategy tester, whether MetaTrader's built-in one, a platform's replay mode or a spreadsheet, is only as honest as the setup it is given. This guide walks through the setup that produces a trustworthy result: data quality and the modelling mode, spread and slippage, the parameters to fix before the run, the report metrics that predict live performance and the ones that mislead, and the optimisation trap that turns a tester into a fitting machine.
A forex strategy tester will produce a report for any rule set you give it, and the report will look authoritative whether the setup behind it was careful or careless. MetaTrader's tester, TradingView's replay and strategy functions, and a well-kept spreadsheet all do the same job: apply rules to history and count what happened. The differences in result come from the inputs, the data, the cost model, the parameters fixed before the run, and from how the report is read afterwards. This guide walks through each, for both coded rules and discretionary rules tested by replay, and ends with the optimisation trap, which is where most tester-produced strategies die.
Setting up a trustworthy test
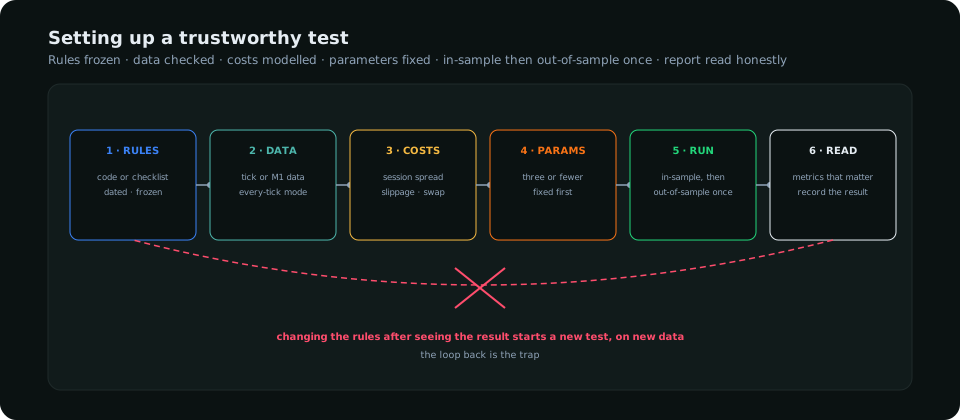
| Setting | Careless | Careful | Why it matters |
|---|---|---|---|
| Data | Broker's default history, one-hour bars, unchecked | Tick or one-minute data from a known source; gaps and weekend bars checked | Interpolated bars fill stops and targets that never traded |
| Modelling mode | "Open prices only" or control points | Every tick (or the platform's equivalent) | Intrabar paths decide whether the stop or the target was hit first |
| Spread | Fixed at the broker's minimum | Variable, or fixed at the session's typical value; wider around releases | Tight-target strategies lose most of their edge to the real spread |
| Slippage | Zero | 0.5 pip normal, 5 pips within five minutes of a red release | Stops fill worse than placed; entries on momentum fill worse than quoted |
| Commission and swap | Ignored | Per-lot commission; swap per night held | Small per trade, material over hundreds |
| Parameters | Adjusted after seeing results | Three or fewer, chosen before the run, with the reasoning written down | Every parameter adjusted after the fact is a degree of freedom fitted to noise |
The data row is the one most often skipped and the one that produces the most convincing false results. A tester fed one-hour bars has to guess the path inside each bar; on a bar whose range covers both the stop and the target, the guess decides the trade, and the default guess is usually optimistic. The backtesting guide covers the biases in more depth; the tester's settings are where most of them enter.
Testing discretionary rules by replay
Rules that cannot be coded (zone identification, a "clean" displacement, a rejection that "looks right") can still be tested with the platform's bar-by-bar replay, provided the rules are written as a checklist first and the test is logged like a coded one. Replay from a date chosen before looking at the chart, advance one bar at a time, and at each bar ask only whether the checklist is satisfied; log every signal including the ones you would have skipped, record the entry, stop and target as of that bar, and advance until the outcome. The discipline is to never scroll ahead. A hundred replayed trades on four-hour charts takes a few evenings and produces a log the expectancy calculation can use. It also surfaces every ambiguity in the rules, which is its second value: a rule you hesitated over twenty times in replay is a rule you will apply inconsistently live.
Reading the report
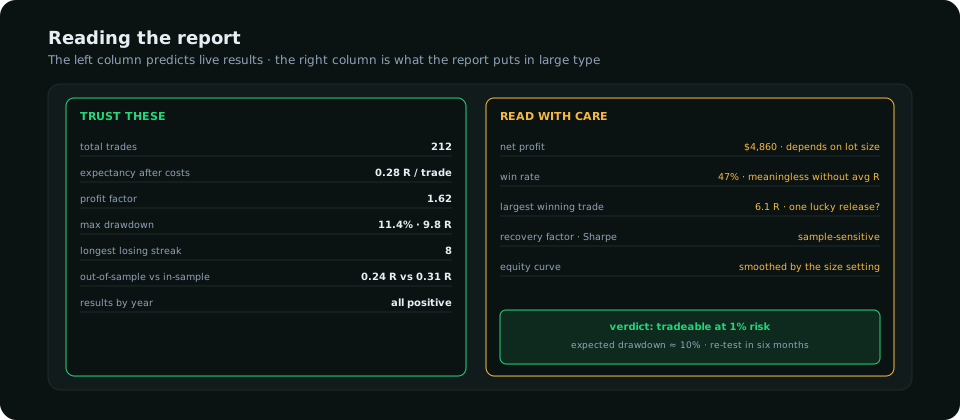
The report leads with net profit and the equity curve, both of which are artefacts of the lot size chosen for the test. Read instead: trade count (below a hundred, nothing else is reliable); expectancy in R after costs; profit factor (gross profit over gross loss; 1.3 to 2.0 is realistic, above 3 is suspicious); maximum drawdown in R and the longest losing streak, which together set the risk per trade the strategy can bear; out-of-sample against in-sample expectancy; and results by year and by pair, which show whether the edge is general or a single regime's. The drawdown guide turns the drawdown figure into a sizing rule. A largest-winning-trade figure that is a large share of net profit means one release or one gap made the strategy; remove it and re-read.
The optimisation trap
Every tester has an optimiser: give it ranges for each parameter and it finds the combination with the best historical result. Used on three parameters with a sensible range each, it is a quick way to see whether the strategy is robust (neighbouring values perform similarly) or fragile (one combination works, the rest do not). Used on eight parameters with wide ranges, it will find a combination that fits the sample perfectly and fails live within weeks, because with enough degrees of freedom any history can be fitted. The rules: fix the parameter count at three or fewer before testing; run the optimiser only to inspect the surface, not to pick the peak; choose a value from the middle of a broad plateau, never the single best cell; and treat any out-of-sample result much worse than in-sample as the optimiser having done its damage. The strategy selection guide covers what a rule set with three parameters looks like; the MT5 setup guide covers the platform where most forex testers run.
A test is a snapshot
A strategy that passed a careful test is a strategy that worked on that history with those costs. Markets change regime, spreads change, and a strategy's edge decays as others find it. Re-run the test every six months on the new data, compare live results against the test's expectancy (a live expectancy below half the tested one over a hundred trades is a signal, not noise), and keep the test's report with the date and the settings so that the next test is comparable. A tester used this way is a measurement instrument; used to find the best-looking curve, it is a machine for manufacturing confidence.
Frequently asked
Which forex strategy tester is best?
MetaTrader 5's tester for coded rules on real tick data; a platform's bar replay for discretionary rules; a spreadsheet for the log and the expectancy. The tool matters less than the data, the cost model and the discipline of not changing rules after seeing results.
How accurate is the MT4 strategy tester?
As accurate as its data and modelling mode. With imported tick data and "every tick" modelling, spread and slippage set realistically, it is adequate; with the default history and "open prices only" it is optimistic enough to be misleading.
How many trades should a strategy test include?
At least a hundred for a rough read and two hundred or more to plan around. The calendar length matters less than the count, provided the period includes at least one regime the strategy should dislike.
Everything on SMC Terminal is analysis and education, not a recommendation to buy or sell. Figures in the example are illustrative. Trading carries a substantial risk of loss. Manage your risk.