XAU/USD Technical Analysis, 16 October 2026: Gold Caught in a Range — Supply at $4,200, Demand at $4,150
Gold price analysis for today, 16 October 2026: on the H1 chart XAU/USD is in the premium half of a three-week range between $4,068 and $4,220, pressing into supply at $4,195–4,220 under a line of descending highs. The marked chart, the nearest supply and demand zones, the VSA signs, the invalidation level and the day's targets.
Gold (XAU/USD) at 06:27 New York time, 16 October 2026: $4,183. On the 1-hour chart the market is in the upper half of a range that has held for three weeks — floor $4,068 (7 October, retested 14 October at $4,078), ceiling $4,220 (3 October) — and is pressing into the supply zone under a line of descending highs. Price has recovered $108 from Tuesday's low in two sessions without a meaningful pullback. That combination — a strong impulse into a supply zone, inside a range, in its premium half — is the setup for today's plan, which is a short from supply with a defined invalidation, and a long only if demand is swept and reclaimed first.
The marked chart
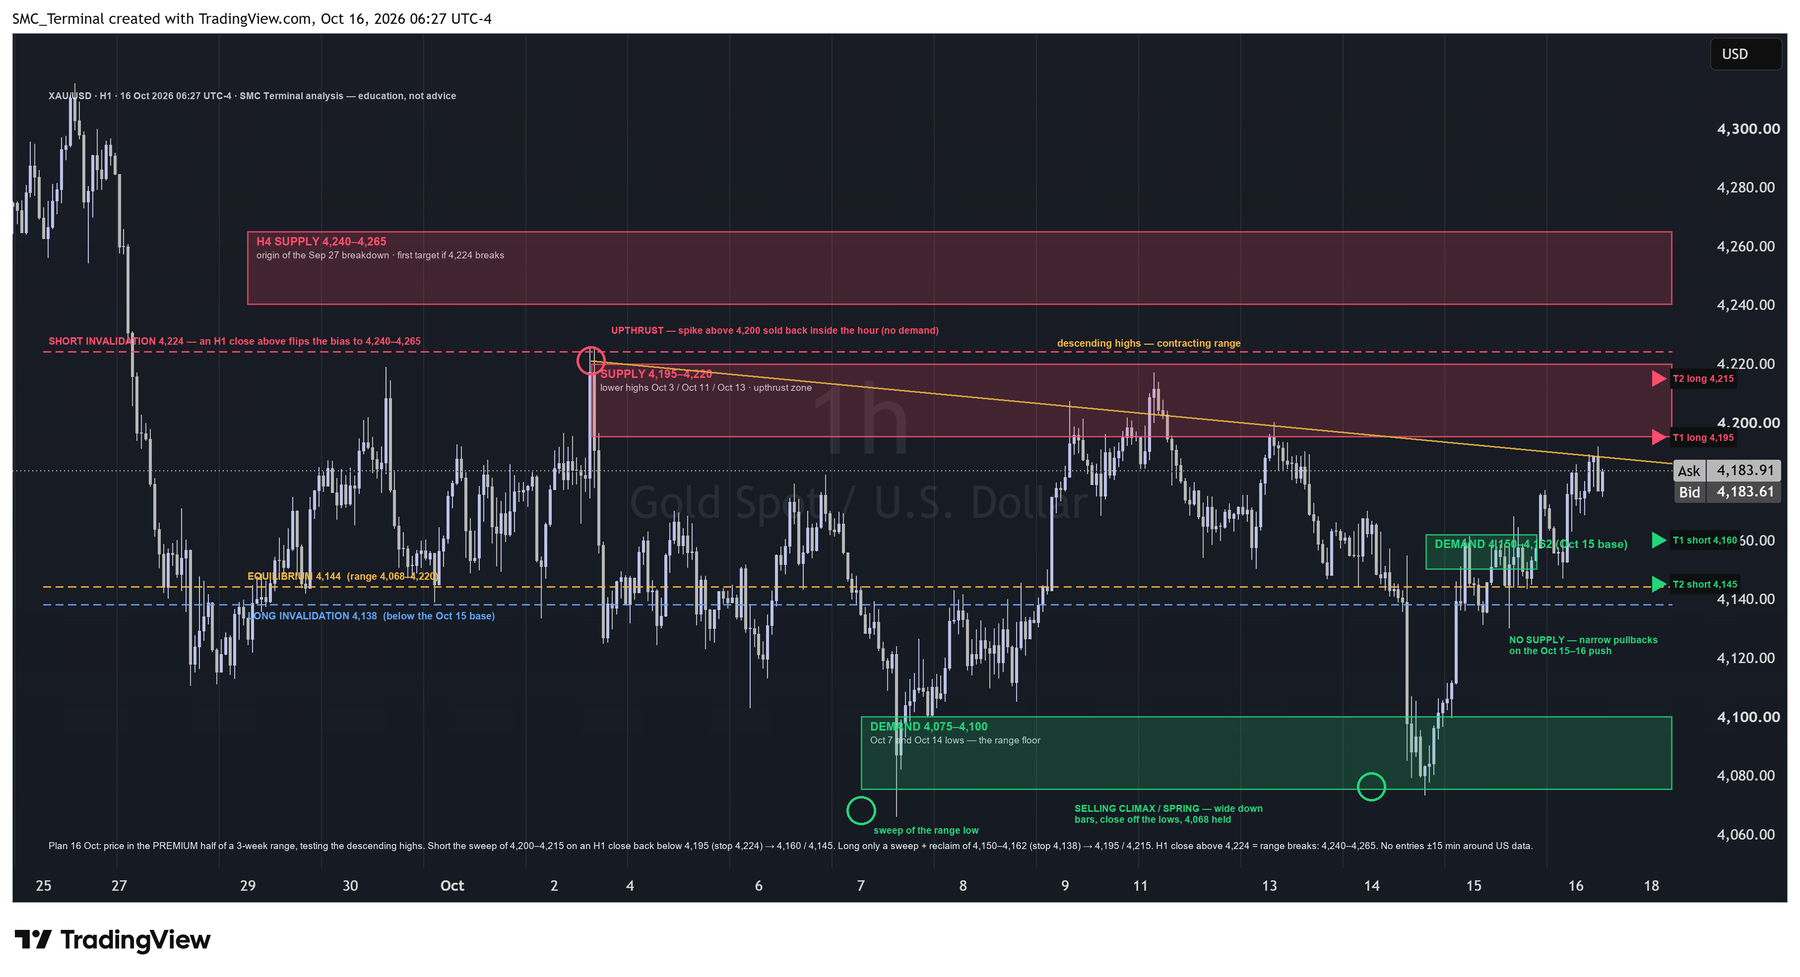
Structure: a contracting range in its third week
The daily trend turned from the 25–27 September top at $4,310: a wide-range break on 27 September took gold from $4,270 to $4,115 in a day, and nothing since has retraced more than half of it. What followed is not a downtrend but a range, and the range is contracting from above. The highs step down — $4,220 on 3 October, $4,215 on 11 October, $4,200 on 13 October — while the lows hold a flat floor at $4,068–4,078. That shape, descending highs on a flat base, usually resolves with a break of the floor; the 14 October flush to $4,078 looked like that break starting and was bought instead, which is the first argument for the other side.
The equilibrium of the range is $4,144 (the midpoint of $4,068 and $4,220). Price at $4,183 is in the premium half, 60% of the way up. The equilibrium rule says shorts are the trades to look for here and longs are to be taken only from the discount half or from a swept level; the plan below follows that.
Nearest supply and demand
| Zone | Price | Why it is there | How to use it today |
|---|---|---|---|
| Supply 1 | $4,195–4,220 | The three descending highs; the 3 October spike was sold back inside the hour; the 11 October high was the last lower high | The short zone: wait for a sweep of $4,200–4,215 and an H1 close back below $4,195 |
| Supply 2 (H4) | $4,240–4,265 | The consolidation that preceded the 27 September breakdown; untested since | First target if $4,224 breaks on a close; not a short zone today |
| Demand 1 | $4,150–4,162 | The 15 October base — the hour of narrow candles from which the $35 impulse to $4,185 launched | The long zone: a sweep of $4,150 and reclaim is the trigger; also T1 for the short |
| Demand 2 | $4,075–4,100 | The 7 October low ($4,068 wick) and the 14 October low ($4,078): the range floor, defended twice | The level the whole range depends on; a close below it changes the picture to a downtrend |
Two refinements. The $4,200 round number sits inside Supply 1, so stops from early shorts cluster just above it — the sweep of $4,200–4,215 before the real move is the expected sequence, not the exception. And Demand 1 is only one hour old as a base; it is the origin of the impulse, which is what gives it weight, but a first retest is the only one to trust.
Volume-spread signs on the chart
The chart carries no volume pane, so these are reads of spread and close position — the part of VSA that survives without the volume bar, and the part that should be confirmed against futures volume on the terminal's Volume & OI tab before being leaned on.
- Upthrust, 3 October. A single hour spiked to $4,220, through every prior high, and closed back at $4,195 — the full range given back inside the bar. That is no demand above $4,200: the buyers who chased the break were met with supply and the price has not been back since.
- Selling climax and spring, 14 October. Three wide down bars took gold from $4,160 to $4,078 in two hours — the widest spreads of the fortnight — and the lowest bar closed well off its low. The next day retraced the whole move. Wide spread, close off the low, immediate recovery, and the $4,068 floor untouched: a stopping-volume signature, and a spring below the 10–13 October lows that trapped the breakdown sellers.
- No supply, 15–16 October. The push from $4,120 to $4,185 has pulled back only in narrow-spread bars of $8–12. Pullbacks that small on the way into supply mean sellers have not yet shown up; it does not mean they will not at $4,200, where they showed up three times.
Read together: the market has rejected both edges of the range with conviction. The floor rejection is the more recent and the more violent, which is why the long scenario below is kept live rather than dismissed — but it is taken only from demand, not chased into supply.
Today's plan
| Primary: short from Supply 1 | Alternative: long from Demand 1 | |
|---|---|---|
| Bias | Range, premium half; descending highs intact while $4,224 holds on a close | Same range; the 14 October spring argues the floor is defended |
| Zone | $4,195–4,220 | $4,150–4,162 |
| Trigger | A sweep of $4,200–4,215, then an H1 (or M15) close back below $4,195; a lower high on M15 confirms | A sweep of $4,150, then a reclaim and an M15 break of structure up |
| Invalidation | $4,224 — above the 3 October high plus a $4 buffer (about 0.4 × the H1 ATR of $10) | $4,138 — below the 15 October base plus the buffer |
| Target 1 | $4,160 (Demand 1, and roughly 1R from a $4,205 entry) | $4,195 (the underside of Supply 1) |
| Target 2 | $4,145 (the equilibrium) | $4,215 (the 11 October high) |
| Size | From the stop, never fixed: $100 of risk on a $19 stop is 0.05 lots (gold pays $100 per $1 per lot). The stop-loss guide has the method. | |
| Management | Half off at target 1; stop to entry only after an M15 structure point forms in the trade's favour; flat before the New York close if neither target is reached. No new entries in the fifteen minutes around US data. | |
Breakout case. An H1 close above $4,224 is not a short invalidation only; it is the range breaking upward, and the descending-highs line failing. The next supply is $4,240–4,265 — the breakdown origin from 27 September. That is the target for a continuation long on a retest of $4,205–4,215 from above, and it is the only long worth taking above the equilibrium today.
What the terminal adds
A chart read is one of eight. SMC Terminal's Symbol Analysis composes it with the reads a chart cannot show, and three of them matter for this plan. Positioning: the CFTC report on Friday said where managed money sits in its three-year range; a crowded long (COT index above 80) gives the short from supply more weight, a washed-out reading gives the floor more. Real yields: the 10-year TIPS yield's direction this week is the macro tide; gold pressing into supply while real yields rise is the short case strengthened, while real yields falling argues for the breakout. Volume & open interest: whether Tuesday's flush came with open interest falling (longs liquidated — a cleaner base) or rising (new shorts — fuel for the spring) is on the Volume & OI tab, and it is the one number that would confirm or deny the selling-climax read above. The gold analysis guide covers how the layers combine.
Frequently asked
Is gold bullish or bearish today?
Neither on the daily chart — it is a range. Intraday the odds favour a reaction lower from $4,195–4,220 because that zone has rejected price three times and the market is in the premium half; a close above $4,224 changes that to bullish.
What is the key level for XAU/USD today?
$4,200. It is the round number inside the supply zone, where both the stops and the sellers sit. How the first hour at $4,200 closes tells you which scenario is running.
Where is the stop for a gold short today?
$4,224, above the 3 October high with a small volatility buffer. A stop at $4,201 or $4,211 is inside the sweep's reach.
Dated analysis: written at 06:30 New York time on 16 October 2026 from the H1 chart shown. Levels age quickly; a day later, read the chart again. Everything on SMC Terminal is analysis and education, not a recommendation to buy or sell. Trading carries a substantial risk of loss. Manage your risk.