GBP/USD Forecast: Cable Drifts Under 1.3320 Into US GDP and PCE With a Bank of England Hike Fully Priced for Next Week
GBP/USD is trading near 1.3319 on 29 October 2026, lower for a fourth day, with the September PCE report and third-quarter GDP due at 12:30 UTC. The pound has a Bank of England hike to 4.00% on 5 November priced at better than 90% after UK inflation rose to 3.5%, and it has fallen anyway. This guide explains why, maps the levels (1.3390 moving-average cluster above, 1.3281 and 1.3255 below), sets out what the US data have to show, and gives a plan for a pair caught between a hawkish Bank of England and a stronger dollar.
Written in the European morning of 29 October 2026, before the 12:30 UTC US release. Levels are from the daily and four-hour charts.
This GBP/USD forecast starts with a puzzle. The pound has a Bank of England rate rise on 5 November priced at better than 90% after September inflation rose to 3.5%, this week's Autumn Budget promised a return to surplus within three years, and the Fed held rates yesterday with a chair who declined to guide. Everything on the British side of the pair says higher. Cable is trading near 1.3319 on 29 October 2026, down for a fourth consecutive session and about a cent below where it started the week. The reason is on the other side of the pair: the dollar has a December hike priced at 85%, and the September PCE report and third-quarter GDP at 12:30 UTC are the next chance for American data to widen that gap. This guide explains why a fully priced hike is not helping sterling, maps the levels above and below, sets out what the US data have to show for each, and gives a plan for a pair that is being pulled in two directions by two central banks a week apart. The dollar-after-the-Fed guide covers the American half.
Where cable is
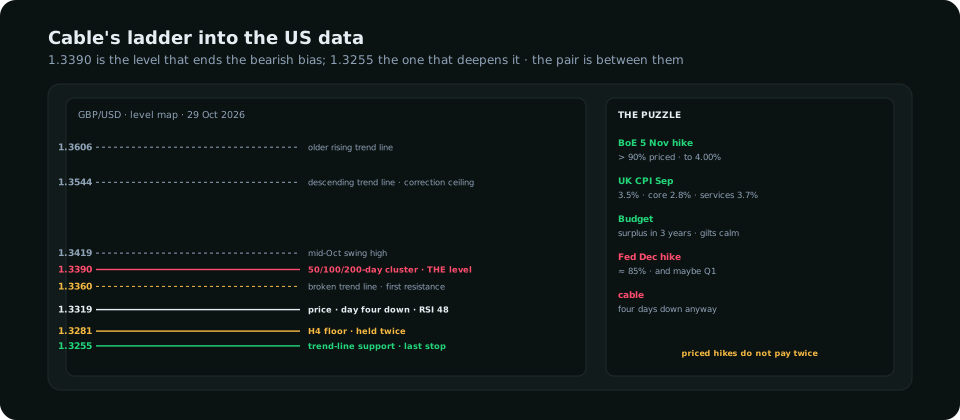
| Level | What it is | Why it matters |
|---|---|---|
| 1.3606 | Older rising trend line | The summer trend the pair fell out of; a month away at least |
| 1.3544 | Descending trend line from the autumn highs | The ceiling of the current correction |
| 1.3419 | Mid-October swing high | Second resistance after the averages |
| 1.3390 | 50, 100 and 200-day moving averages, all within a few pips | A daily close above it ends the bearish near-term bias; the single most important level on the chart |
| 1.3356–1.3360 | Broken upward trend line, now resistance | First resistance; where Wednesday's post-Fed bounce stalled |
| 1.3319 | Price as this is written | Fourth day down; RSI near 48, momentum fading rather than oversold |
| 1.3281 | Recent floor on the four-hour chart | Held twice this month |
| 1.3255 | Repurposed downward trend line | The level technicians have flagged as the last support before a deeper pullback |
Why a priced hike is not helping the pound
- It is priced. UK CPI rose to 3.5% in September from 3.1%, with core at 2.8% and services at 3.7%, above the Bank's own projections. The market moved the November hike from about 65% in late September to above 90%. Sterling rose while that repricing happened; it cannot rise again on the same news. The Bank's September vote was 6–3 with three members already wanting a hike, so the November decision is the least surprising event on the calendar.
- The Fed's path is steeper. Bank Rate at 3.75% going to 4.00% looks like the Fed's 3.75–4.00% going to 4.00–4.25%. The difference is what comes after: the market has a second Fed hike in play for early 2027 and most forecasters see the Bank of England peaking near 4.25%. Equal rates with a steeper American path is a lower cable.
- The Budget was a relief, not a rally. The Chancellor's plan to eliminate the current deficit and reach surplus within three years was received calmly by the gilt market, which is what the pound needed; the Office for Budget Responsibility noted that the Middle East war complicates every forecast. A budget that avoids a gilt sell-off removes a negative. It does not add a positive.
- Energy. Britain imports its energy and Brent is at $114. The same inflation that forces the Bank to hike taxes the economy the Bank is hiking into. The pound, like the euro, gets the inflation without the growth.
Two central banks, one week apart
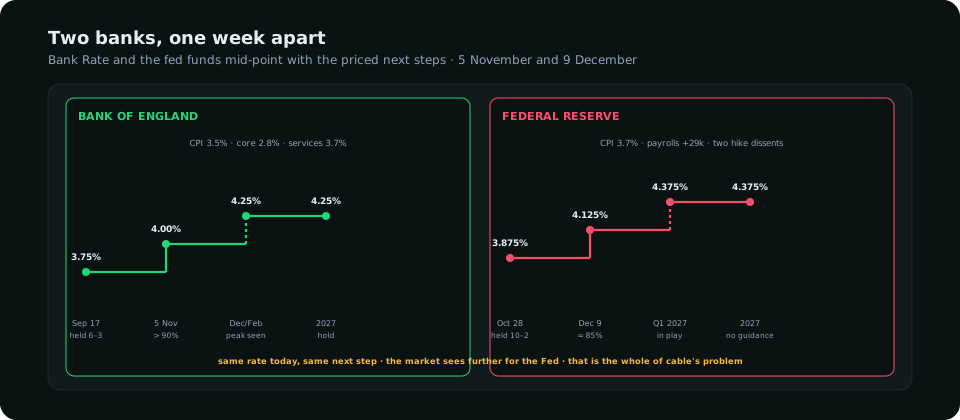
The pair's problem in one picture: the two banks are at the same rate, both have the next hike priced, and the one whose market sees further to go is the American one. For cable to turn, either the Bank of England has to signal more than one more hike on 5 November, or the US data have to take the second Fed hike away. Today's release is the first of those tests.
What the US data have to show
| Core PCE (m/m) | Q3 GDP | GBP/USD |
|---|---|---|
| 0.4% | Any | Through 1.3281 and a test of 1.3255 inside the session; the fifth down day |
| 0.3% | Near 3.2% | 1.3281–1.3360 range; the ECB at 13:15 UTC moves the euro and cable follows at half speed |
| 0.2% | Below 2.5% | Back through 1.3360 and a run at the 1.3390 averages; the losing streak ends |
The GDP and PCE guide sets out the combinations in more detail. For cable the core PCE line is the only one that matters; the GDP headline will be large and the market will call it productivity.
A plan
- The bias is down until a daily close above 1.3390. Four down days with RSI at 48 is a grind, not a capitulation. Grinds continue until something breaks them, and the thing that breaks this one is the averages.
- Sell the bounce, not the break. With 1.3255 only sixty pips below, selling a break of 1.3281 earns a poor ratio. Selling a bounce into 1.3356–1.3360 with a stop above 1.3390 and a target at 1.3281, then 1.3255, is the trade the chart offers.
- Buy only on a soft core PCE. A 0.2% print is the one outcome that changes the American path. Buy the pullback after the spike, stop below 1.3281, target 1.3390. Expect the averages to hold the first attempt.
- Carry the view into 5 November with care. The Bank of England hike is priced; the vote split and the guidance are not. A 9–0 vote with talk of further moves is the pound's best case; a 6–3 with a "wait and see" is the worst, and the pair could fall on a hike. Reduce size into that decision rather than adding to it.
Cable's spread at 12:30 UTC on a US data day widens briefly and the first candle regularly covers fifty pips. Stops belong beyond 1.3390 or below 1.3255, not inside the range; the stop placement guide and the risk management rules cover the sizing.
What to read in the terminal
The Positioning dashboard shows the speculative sterling position from Tuesday's CFTC report; the long built during the September repricing has been cut for three weeks, which is the four down days in another form. The intermarket panel scores GBP/USD against the gilt–Treasury two-year spread, which has been flat since the UK CPI print: the UK's hike is in, the US's is in, and nothing is moving the differential. That is why cable is drifting rather than trending, and why today's US data, not next week's Bank of England, is the event that can change it.
Frequently asked
Why is GBP/USD falling if the Bank of England is about to hike?
Because the hike is already priced at better than 90% and the Fed's expected path is steeper. UK CPI at 3.5% moved the November hike from about 65% in late September to above 90% and sterling rose then; it cannot rise again on the same news. Meanwhile the market prices a Fed hike in December at 85% and another in early 2027. Equal rates with a steeper American path pushes cable lower.
What are the key GBP/USD levels today?
Resistance at 1.3356–1.3360 and the moving-average cluster at 1.3390, then 1.3419. Support at 1.3281 and 1.3255. A daily close above 1.3390 would end the near-term bearish bias; a close below 1.3255 would open a deeper pullback.
When is the next Bank of England decision?
Thursday 5 November 2026. Bank Rate is 3.75% after a 6–3 hold in September, and the market prices a quarter-point rise to 4.00% at above 90%.
What US data is due today?
The advance estimate of third-quarter GDP (consensus 3.2% annualised) and the September PCE price index (core consensus 0.3% month on month, 3.1% year on year) at 12:30 UTC on 29 October 2026, followed by the ECB decision at 13:15 UTC.
Everything on SMC Terminal is analysis and education, not a recommendation to buy or sell. Levels are from the European morning of 29 October 2026 and change continuously. Trading carries a substantial risk of loss. Manage your risk.