Dollar Index Holds 102 Into the PCE Report: The 102.60 Trigger, the 101.50 Floor and What Core PCE Has to Print
The US dollar index is trading near 102.25 on the morning of 29 October 2026, holding its October gains after the Fed's hold and ahead of the September PCE inflation report and third-quarter GDP at 12:30 UTC. This guide is the level map: 102.60 and the 102.94 October high above, 102.05, 101.50 and the 100-day average at 100.65 below, with an RSI near 60. It sets out what core PCE has to print for each level to come into play, how the ECB forty-five minutes later changes the euro's 57% weight, and a plan for the session.
Written in the European morning of 29 October 2026, before the 12:30 UTC release. Levels are from the daily chart.
The US dollar index is holding above 102 into the most important data release of the week. It trades near 102.25 in the European session of 29 October 2026, a little below where it stood before the Fed's hold yesterday and a little above where it closed after Chair Warsh's press conference knocked it back. The September PCE inflation report and the first estimate of third-quarter GDP land together at 12:30 UTC. The consensus is core PCE up 0.3% on the month and 3.1% on the year, from 3.0%, and growth of 3.2% annualised, from 2.2%. The dollar's October rally has paused rather than reversed: the index is above its 100-day average, its RSI sits near 60, and the pullback from the 14 October high at 102.94 has so far held the middle of the Bollinger band. This guide is the level map for the session, with what the inflation data have to print for each level to matter and how the ECB decision forty-five minutes later changes the arithmetic for an index that is 57% euro. The DXY guide explains the index itself; this piece is today's chart.
The level ladder
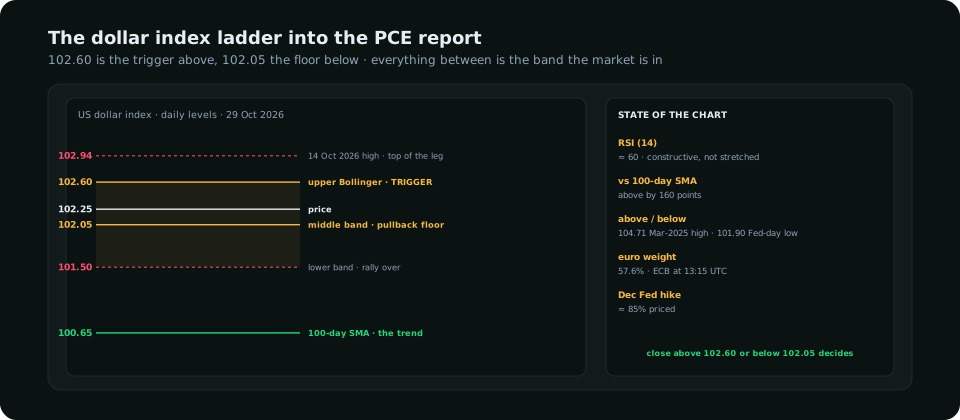
| Level | What it is | What it takes |
|---|---|---|
| 104.71 | 27 March 2025 high; the next major reference above | A December hike plus a January one priced; weeks, not a session |
| 102.94 | 14 October 2026 high, the top of the current leg | A hot PCE and a soft ECB on the same afternoon |
| 102.60 | Upper Bollinger band; a daily close above it opens the path to 104.71 | Core PCE 0.4% or GDP above 3.5% |
| 102.25 | Price as this is written | — |
| 102.05 | Middle Bollinger band (20-day average); the pullback floor so far | An in-line print keeps the index here |
| 101.90 | Fed-day low on the statement | The first level that says the post-Fed dip was not the whole correction |
| 101.50 | Lower Bollinger band | Core PCE 0.2% and a dovish read of the Fed; the rally is over for the month |
| 100.65 | 100-day simple moving average | The trend line; below it the October move is fully retraced |
| 100.00 | Round number | Psychological; where the summer range sat |
What PCE has to print
The PCE deflator is the Fed's preferred inflation measure and the one its 2% target is written against. The CPI for September already printed 3.7%, so the market knows roughly what is coming; what it does not know is the core PCE monthly figure to the decimal, and that decimal is the trade.
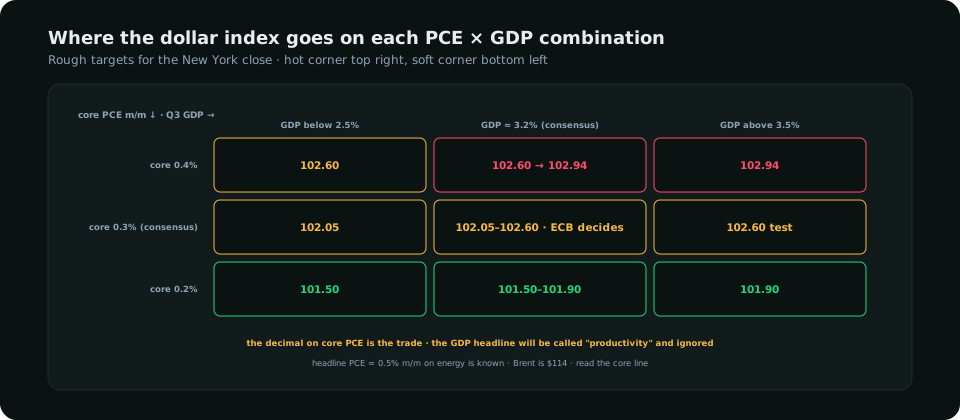
- 0.4% core, GDP 3.2% or better. Inflation is re-accelerating in the Fed's own measure while growth is strong. December goes to 90%-plus and a January hike comes back into the price without the Fed saying anything. The index closes above 102.60 and 102.94 is the next session's business.
- 0.3% core, GDP near 3.2%. Exactly what is priced. The index holds 102.05–102.60 and the ECB decides the close through the euro. This is the most likely outcome and the least interesting one.
- 0.2% core. The first soft core print since the summer. Yesterday's "caution" from the chair gets data behind it, December odds slip toward 70%, and the index tests 101.50 with 100.65 the target over the following week. GDP barely matters in this row; the market will call strong growth "productivity" and move on.
Headline PCE is expected at 0.5% on the month because of energy. It will make the headlines and move nothing, because everyone can see Brent at $114. Ignore it and read the core line.
The ECB complication
The euro is 57.6% of the dollar index. At 13:15 UTC, forty-five minutes after the US data, the ECB publishes a decision that is expected to hold the deposit rate at 2.50% and may or may not point to December. That means the index can move for reasons that have nothing to do with American inflation: a firm December signal from Frankfurt takes EUR/USD through 1.1160 and the index down twenty or thirty points regardless of what PCE said; a hesitant Council does the opposite. The honest way to trade DXY today is as EUR/USD with extra steps, and today's EUR/USD range guide and ECB preview are the other half of this analysis. The pound, at 11.9% of the index, has its own Bank of England hike priced for next week and is covered in the cable guide.
A plan for the session
- Pre-release: no position. The index is in the middle of its band and the two events are too close together for a position taken on the first to survive the second.
- 12:30 UTC: read core PCE, then wait. A 0.4% print is the only one worth acting on before the ECB, because it changes the Fed path regardless of Frankfurt. Buy the index, or sell EUR/USD, on the first pullback after the spike, with 102.60 as the first target.
- 13:15–14:30 UTC: the ECB window. If PCE was in line, the ECB's tone sets the close. Trade EUR/USD directly rather than the index; the index is the euro with a lag today.
- Daily close: the only signal that counts. Above 102.60 the October rally resumes with 102.94 and then 104.71 ahead. Below 102.05 the Fed's caution has won the week and 101.50 is next. In between, which is the most likely result, nothing has been decided and Friday's euro-area GDP and the Bank of Japan take over.
On a day like this a dollar-index stop sits beyond the Bollinger band, not inside it: 102.60 and 101.50 are the levels the market will test to find stops, and the stop placement guide covers how to sit beyond them without giving up the ratio.
What to read in the terminal
The macro-regime panel decomposes the dollar's move into the Fed path, real yields and risk. Yesterday's decline was entirely the first component. The intermarket panel scores the index against the two-year Treasury yield; the correlation this month has been tight, which is why the PCE core line, not the GDP headline, is the number to read. The Positioning dashboard shows the speculative dollar long from the CFTC report, built through October's rally; a crowded long is why an in-line print may produce a lower index rather than an unchanged one.
Frequently asked
What time is the PCE report today?
The September PCE price index is released at 12:30 UTC on Thursday 29 October 2026 (08:30 New York, 17:30 Pakistan), together with the advance estimate of third-quarter GDP. Consensus is core PCE 0.3% month on month and 3.1% year on year, and GDP growth of 3.2% annualised.
Where is the dollar index now?
Near 102.25 in the European session, above the 100-day average at 100.65 and below the upper Bollinger band at 102.60. The October high is 102.94 on the 14th; the Fed-day low was just above 101.90.
What is the key DXY level to watch?
102.60. A daily close above it on a hot PCE print opens the way to the 102.94 October high and, over weeks, the March 2025 high at 104.71. Below, 102.05 is the pullback floor and 101.50 the level that would say the October rally is over.
Why does the ECB matter for the dollar index?
The euro makes up 57.6% of the index. The ECB decision at 13:15 UTC, forty-five minutes after the US data, can move EUR/USD by half a percent on tone alone, which moves the dollar index by a quarter of a percent in the opposite direction regardless of what PCE printed.
Everything on SMC Terminal is analysis and education, not a recommendation to buy or sell. Levels are from the European morning of 29 October 2026 and change continuously. Trading carries a substantial risk of loss. Manage your risk.