Best TradingView Indicators for Forex: Features, Uses and Limitations
TradingView has over a hundred built-in indicators and a community library of hundreds of thousands. Most forex traders need six. This comparison covers the built-ins and community scripts that earn a place on a forex chart, what each is good for, the limitation each one hides, and the two kinds of information no TradingView indicator can show.
TradingView's indicator library is the largest in retail trading, which is both its strength and the reason most forex charts on it look like a circuit board. The platform ships more than a hundred built-in studies and hosts hundreds of thousands of community scripts in Pine. The job is not to find the best ones in the abstract. It is to find the few that answer a question your plan actually asks, understand what each one cannot do, and leave the rest alone. The companion article on choosing indicators for a plan covers the selection logic; this one compares the specific tools.
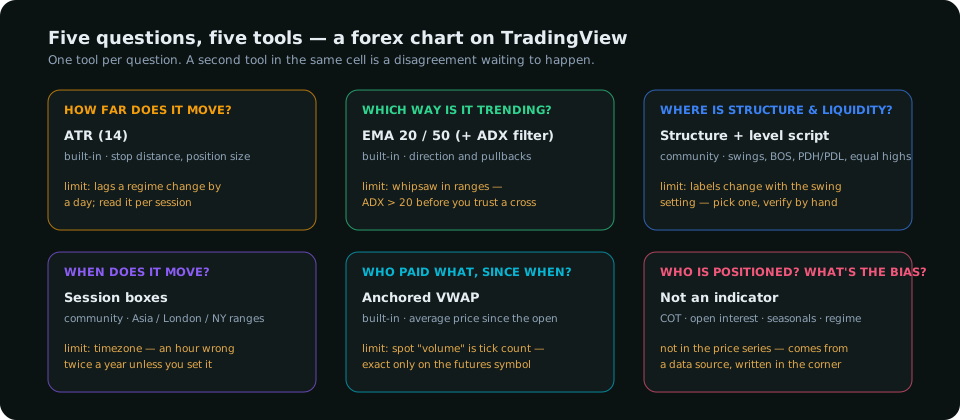
Built-in indicators worth keeping
Average True Range (ATR)
What it does: the average candle range over a period, in price. Use it for: stop distance and position size — a stop one ATR beyond a level survives normal noise; the sizing formula runs on it. Limitation: it is a trailing average, so it under-reads the first day of a volatility regime change (the day after a surprise central-bank decision) and over-reads the week after. Use the 14-period on the timeframe you trade, and check it against the session: gold's hourly ATR at 03:00 New York time and at 08:30 are different instruments.
Exponential moving averages (20 and 50)
Use it for: a systematic trend direction and a pullback reference. Limitation: whipsaw in ranges; the trend-indicator comparison shows how much. Two averages. Not five.
Average Directional Index (ADX)
Use it for: telling a trend from a range before you apply a trend tool — ADX above 20 to 25 is the usual filter. Limitation: it lags badly at trend starts; it is a filter for entries, never a trigger.
Volume (and why it is a proxy in forex)
Spot forex has no central tape. TradingView's volume bars on a forex chart are the broker's tick count or, on a futures symbol, the exchange's real volume. The tick-count version is a usable proxy for activity — it rises in London and New York and collapses in Asia — but it is not contract volume and cannot be compared across brokers. For real volume and open interest you need the futures contract (6E for the euro, GC for gold), which TradingView does chart.
Anchored VWAP
Use it for: the average price paid since a chosen point — a session open, a news release, a swing low. Price above the anchored VWAP from the London open means the session's buyers are in profit; below it, under water. Limitation: it inherits the volume problem above on spot symbols; on futures it is exact.
Community scripts that earn a place
Pine scripts are where TradingView's forex value actually lives, because the built-ins were written for stocks. Three categories matter. Script names change and authors come and go, so these are described by function; search the public library for the function and read the code before trusting it.
- Session boxes. A script that draws the Asian, London and New York windows as boxes with their highs and lows. For a session-based plan this is the single most useful thing on the chart: the Asian range is the day's first liquidity pool, and the London and New York windows are when the plan's triggers count. Set it to your broker's timezone or it will be an hour wrong twice a year.
- Market-structure labelling. Scripts that mark swing highs and lows and label breaks of structure and changes of character. Limitation, and it is a big one: every such script has a swing-detection parameter, and the labels change with it. A "break of structure" on a 3-bar swing setting is noise on a 10-bar setting. Pick one setting, keep it, and verify a sample by hand — the SMC strategy explains what the labels are supposed to mean.
- Liquidity and level mapping. Scripts that draw equal highs and lows, previous day and week highs and lows, and the Asian range as lines. These are mostly arithmetic and therefore reliable; the value is not having to draw twelve lines by hand every morning.
Indicators to remove from a forex chart
- Any second oscillator. RSI and stochastic and MACD measure the same momentum three ways and disagree only at turns.
- Any "buy/sell signal" script. Arrows on a chart are an indicator with its rules hidden. If you cannot read the rule, you cannot know when it stops working.
- Pivot points on a 24-hour market. Daily pivots are built from a "close" that forex does not have. Session highs and lows are the real levels.
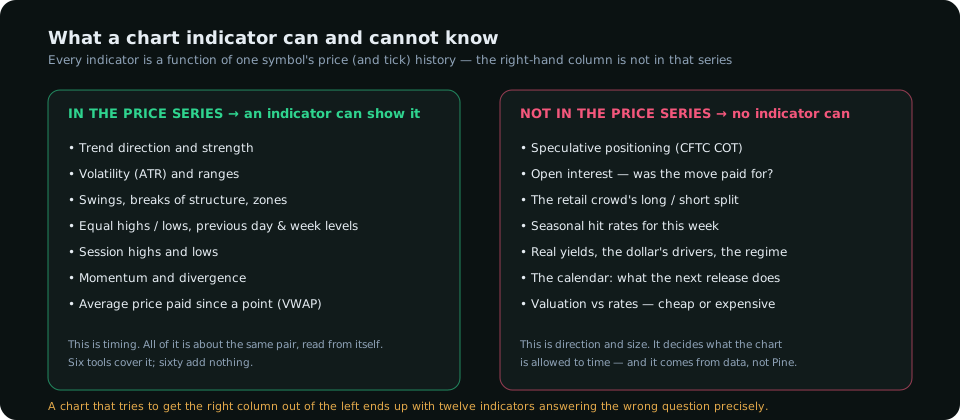
The two things no TradingView indicator can show
This is the limitation that matters, and it is structural rather than a flaw in any script. Every indicator — built-in or community, free or paid — is a calculation on the price and volume of the symbol on the chart. Two categories of information are not in that series.
- Who is positioned. The CFTC's weekly report on speculative positioning, the exchange's daily open interest, the retail crowd's long/short split. A pair at a record speculative long looks on the chart exactly like a pair at a neutral position; the chart does not know. The COT report for forex is the first of these; it is a web page or a data terminal, not a Pine script (someone has published COT overlays, but they re-plot the same weekly number and cannot compose it into pair reads).
- What the calendar and the regime say. That a release in three hours has moved this pair 80 pips on average, that the pair has fallen in nine of the last ten Octobers, that real yields and the dollar have both turned — these are statistics about other series, and they decide direction and size before the chart decides timing.
The honest division of labour: TradingView for the chart — structure, levels, sessions, ATR — and a research source for the data that sets the bias the chart is allowed to execute. Traders who try to get the second category out of the first end up with twelve indicators and a chart that answers the wrong question very precisely.
A clean forex chart on TradingView
Candles. The 20 and 50 EMA. ATR in a lower pane. A session-box script. A level-mapping script for previous day and week highs and lows. Structure labels only if you have checked the setting by hand. Nothing else, and the bias written in the corner from the data before the session starts. That chart is faster to read than any indicator stack, and every line on it has a rule behind it.
Everything on SMC Terminal is analysis and education, not a recommendation to buy or sell. TradingView is a third-party product; indicator availability and script names change. Trading carries a substantial risk of loss. Manage your risk.