Best Trend Indicators for Forex: How to Compare Their Signals
Moving averages, MACD, ADX, Supertrend, Ichimoku, Donchian channels — every trend indicator answers a slightly different question with a slightly different lag. This is how to compare them on the same chart, score their signals honestly, and pick the one that fits your holding time.
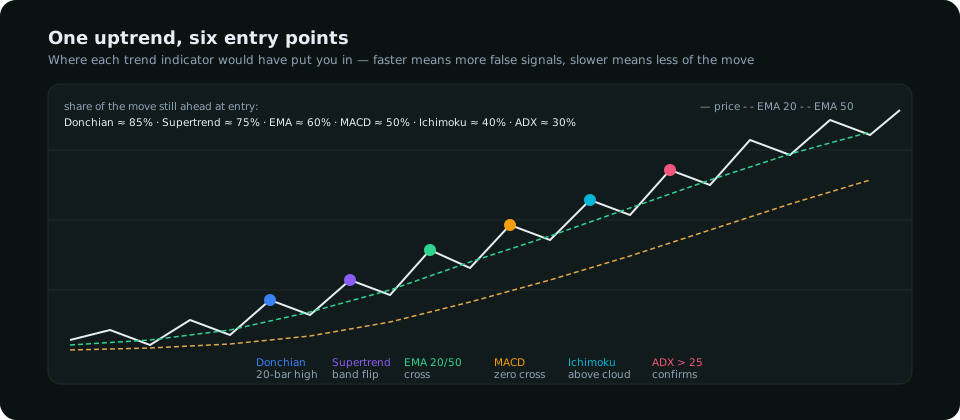
Ask five traders for the best trend indicator and you get five answers, each defended with a chart where it worked. The problem is not that any of them is wrong. It is that "trend indicator" covers tools that measure different things — direction, strength, momentum, volatility-adjusted position — and comparing them by anecdote tells you nothing. This article compares the six most used trend indicators on the same terms: what each one measures, how far it lags, how it fails, and which holding time it suits. Then it shows a simple way to score their signals so you can decide with numbers rather than with the last chart you saw.
What "trend" means to each indicator
Price trends when it makes higher highs and higher lows (or the reverse). That is a structural fact you can see without any indicator — the market-structure vocabulary is built on it. Indicators exist to make that fact systematic: to produce the same answer every time, without the trader's mood in the loop. Each does it by compressing price history into a number, and the compression is where they differ.
| Indicator | What it actually measures | Lag | Fails most in | Suits |
|---|---|---|---|---|
| EMA crossover (20/50) | Whether recent average price is above older average price | Medium | Ranges — repeated whipsaw crosses | Swing, days to weeks |
| MACD | The gap between two EMAs, and its momentum | Medium | Slow drifts — signals late, exits later | Swing |
| ADX (with +DI/−DI) | Trend strength, direction from the DI lines | High | Confirms a trend after much of it is done | Filtering, any timeframe |
| Supertrend | Price relative to an ATR-based trailing band | Low–medium | Volatile ranges — flips on every spike | Intraday to swing |
| Ichimoku cloud | Price vs a mid-range band projected forward | Medium–high | Clutter; needs a settled trend to read | Daily and above |
| Donchian channel (20) | Whether price is at a 20-period high or low | None at the break, high for exits | False breaks; gives back open profit | Position, weeks |
How to compare them properly
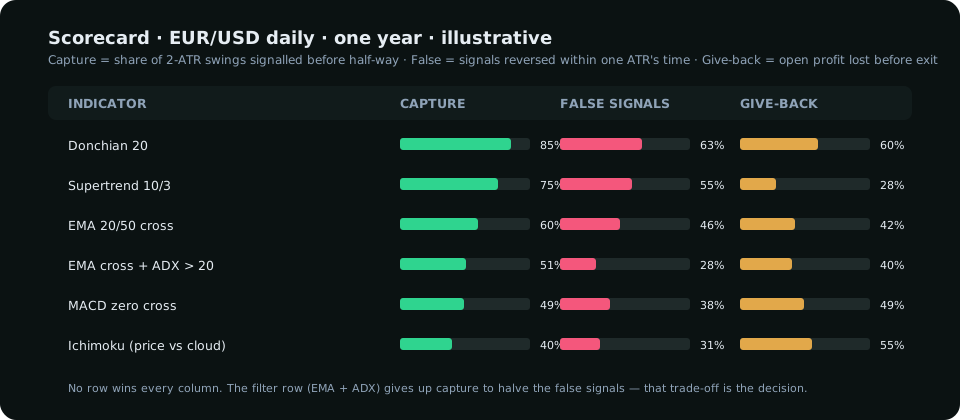
Put the indicators on the same pair and timeframe over the same period — at least a year of daily data or three months of hourly — and record every signal each one gives. Then score three things.
- Capture. Of the moves that were worth catching (say, every swing of more than two daily ATRs), what share did the indicator signal before half the move was over?
- False-signal rate. Of all signals, what share reversed within the time it would take to earn one ATR? These are the trades that lose.
- Exit give-back. On the winning trades, how much of the peak open profit was given back before the indicator said exit? Donchian and Ichimoku are notorious here; Supertrend is tighter.
Write the three numbers next to each indicator. The one with the best capture usually has the worst false-signal rate, and the one with the lowest give-back usually has the lowest capture. There is no indicator that wins all three; there is only the combination of the three you can live with.
Using two at once (and only two)
The useful combinations pair a direction tool with a strength filter, because that is the pair of questions a trend trade needs answered: which way, and is it worth it.
- EMA crossover + ADX above 20. The crossover gives the direction; the ADX filter removes the crosses that happen inside ranges, which is where almost all of the crossover's losses come from. Expect fewer trades and a much better false-signal rate.
- Donchian break + Supertrend exit. Enter on the 20-period break, which has no lag, and exit on the Supertrend flip, which gives back less than the opposite Donchian band. This is a position-trader's pairing.
- Structure + anything. If the daily chart is not printing higher highs and higher lows, no trend indicator should be taking longs. The chart is the primary; the indicator is the clerk.
Three or more trend indicators on one chart is not more confirmation. They are all reading the same price series, so they agree in the easy trends and disagree only at the turns, which is exactly when you need a clear answer and get a committee instead. The guide to what each indicator measures explains why stacking tools that measure the same thing adds nothing.
What trend indicators cannot see
Every tool above is a function of past prices of one pair. None of them knows that speculators are at a record net long (the COT report does), that the pair is in a window where it has fallen nine of the last ten years, that the dollar's drivers have turned, or that a central-bank meeting is in six hours. A trend indicator will keep you long into a crowded top because the price is still above the average. That is not a flaw in the indicator; it is the limit of what price alone can tell you. The traders who use these tools well use them for timing and let the data decide the direction they are allowed to time.
A practical recommendation
For a swing trader holding days to weeks: the 20/50 EMA crossover on the daily chart, filtered by ADX above 20, with the stop under the last structural low and the exit on a close through the 50. For an intraday trader: Supertrend on the hourly chart for direction, traded only in the direction of the daily structure and only inside the session windows where the pair actually moves. For a position trader: Donchian 20 entries with a Supertrend trailing exit. Pick one, score it for fifty trades, and change it only when the numbers — not a bad week — say to.
Everything on SMC Terminal is analysis and education, not a recommendation to buy or sell. Indicator settings and scorecard figures are illustrative; test on your own data. Trading carries a substantial risk of loss. Manage your risk.