How to Use the MACD Indicator to Analyse Forex Trends
The MACD indicator compresses two moving averages into one picture of trend and momentum, and most traders read only its crossovers. This guide explains what each of its three parts measures, how to read the histogram as momentum rising and fading, which MACD signals hold up in forex and which don't, and how to combine it with market structure instead of trading it alone.
Gerald Appel built the Moving Average Convergence Divergence indicator in the late 1970s to answer one question about a trend: is it speeding up or slowing down? That is still what it does best. The trouble is that MACD is usually taught as a signal generator — "buy the crossover" — which turns a good momentum gauge into a late, whipsaw-prone entry trigger. This guide takes the indicator apart, shows what each part is actually measuring, and then puts it back together as a tool for analysing forex trends rather than trading them blind.
The three parts
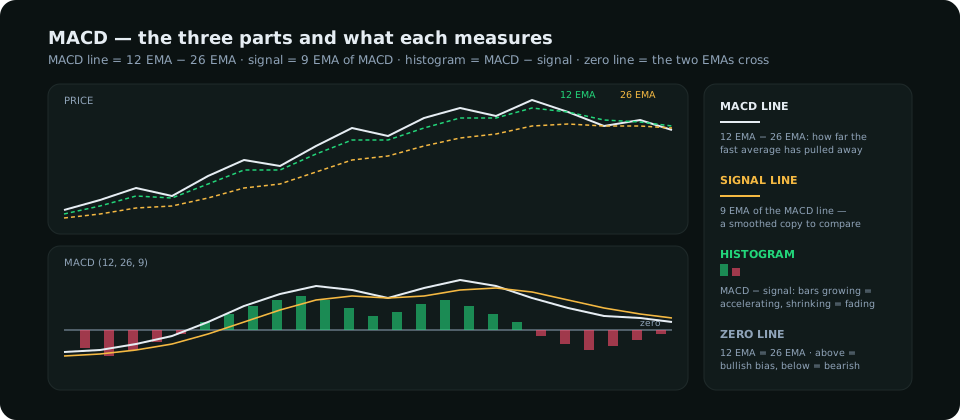
| Component | Calculation (default 12 / 26 / 9) | What it measures |
|---|---|---|
| MACD line | 12-period EMA − 26-period EMA | How far the fast average has pulled away from the slow one — the trend's momentum, in price units |
| Signal line | 9-period EMA of the MACD line | A smoothed version of the MACD line, so the two can be compared |
| Histogram | MACD line − signal line | Whether momentum is accelerating (bars growing) or fading (bars shrinking) |
| Zero line | MACD = 0 | The 12 EMA equals the 26 EMA; above it the short-term average is higher (bullish bias), below it lower |
Two things follow. First, MACD is unbounded — unlike RSI it has no 0–100 scale, so "overbought" has no meaning; a reading is large or small only relative to the pair's own recent history. Second, everything in it is built from moving averages, so it lags: a crossover confirms what price did over the last dozen bars, it does not anticipate the next one.
The four readings, ranked by usefulness
1. Histogram momentum (the one to learn first)
Watch the bars, not the lines. In an uptrend the histogram grows as the move accelerates and shrinks before price turns: the first smaller bar after a run of growing bars is momentum fading, often several candles before the signal-line crossover. Reading the histogram this way gives you the earliest honest information MACD has, and it is the basis of the divergence read below.
2. Zero-line position (the regime filter)
Above zero, the 12 EMA is above the 26 — the medium-term trend is up and long setups have the wind behind them. Below zero, the reverse. Used on the 4-hour or daily chart this is a simple, robust regime filter: only take hourly entries in the direction the higher-timeframe MACD sits on. The strategy guide explains why a regime filter matters more than any entry.
3. Divergence (the warning)
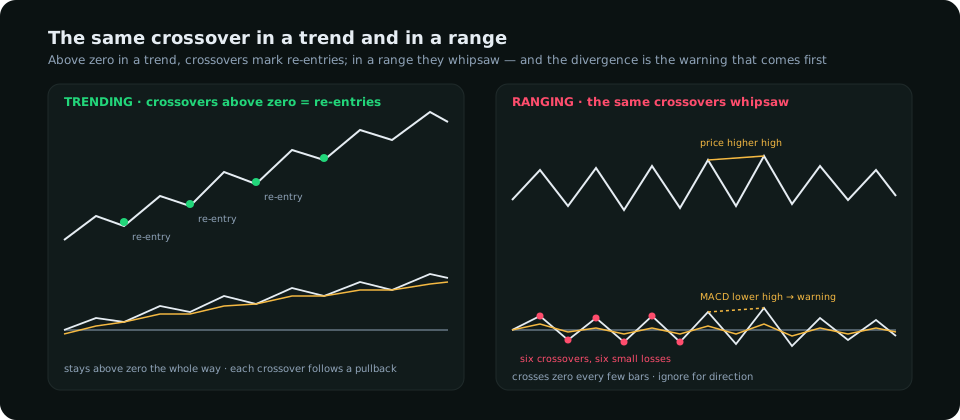
Price makes a higher high; the MACD histogram (or line) makes a lower high. The second push had less momentum than the first. As with RSI divergence, this is a reason to tighten management and stop adding, not to short the high — strong trends print two or three divergences before they end. Hidden divergence (price higher low, MACD lower low) is a continuation sign and the more reliable of the two.
4. Crossovers (the one everyone trades, and the weakest)
MACD line crossing the signal line is the textbook signal. In a trend it works adequately for re-entries after a pullback; in a range it produces a loss every few bars, because the two averages chase each other through the chop. Never trade a crossover without the zero-line and structure context.
Using MACD with market structure
MACD is at its best confirming a decision made elsewhere. A practical sequence for forex:
- Direction from structure on the daily or 4-hour chart — higher highs and higher lows, or the reverse — and from the drivers behind the pair (rates, positioning).
- Regime check: is the 4-hour MACD on the same side of zero? If not, the setup is counter-trend and the size should say so.
- Pullback timing on the hourly: the histogram shrinking toward zero during the pullback, then printing its first growing bar in the trend's direction, lines up with a sweep-and-shift entry at a zone (see the market-structure method).
- Exit management: histogram bars shrinking after an extended run, or a regular divergence at a higher-timeframe level, are the cue to take partial profit or trail the stop.
In that sequence MACD never decides direction; it tells you whether momentum agrees with the direction you already have. That is the role a moving-average-based tool can actually fill.
Settings and timeframes
- 12 / 26 / 9 is fine. Faster settings (5 / 35 / 5, 8 / 17 / 9) add signals and noise in equal measure; most traders who change them are trying to make crossovers less late, which the indicator cannot deliver.
- Timeframe: read it on the same chart you read structure on, one timeframe higher for the regime. A 5-minute MACD says nothing about a daily trend.
- Forex specifics: currency pairs spend most of the time ranging, so the zero-line and histogram readings do more work here than in a trending stock index. Gold and the indices, which trend harder, give crossovers a better record — the gold indicators guide compares them.
Common mistakes
- Trading every crossover. In a range this is a reliable way to pay the spread twenty times a week.
- Calling a reading "overbought". MACD has no bounds; a high value in a strong trend is normal.
- Shorting the first divergence in a trend. Wait for structure to break.
- Stacking it with RSI and a stochastic. All three measure momentum from the same closes; three agreeing oscillators are one opinion repeated. Pair MACD with something it does not contain — structure, volume, positioning.
Quick reference
| Reading | In a trend | In a range |
|---|---|---|
| Histogram growing | Momentum building — hold, don't fade | A swing toward the range edge |
| Histogram shrinking | Pullback starting, or the trend tiring if extended | Approaching a turn at the edge |
| Above / below zero | The side to trade | Flips often; ignore for direction |
| Signal crossover | Re-entry after a pullback, with structure | Noise |
| Regular divergence | Tighten management; wait for a structure break | Reversal setup at the edge |
| Hidden divergence | Continuation confirmation | Weak |
Everything on SMC Terminal is analysis and education, not a recommendation to buy or sell. Trading carries a substantial risk of loss. Manage your risk.