How to Use VWAP in Intraday Trading: Setups and Common Mistakes
The VWAP indicator is the one line on an intraday chart that institutions actually watch, because it is the price they are benchmarked against. This guide explains what VWAP measures, why it anchors to the session, the three setups it supports (trend pullback, band fade, reclaim), and the mistakes that turn a useful reference into a losing signal.
The VWAP indicator, the volume-weighted average price, is the average price a market has traded at during the session, with each trade weighted by its size. Funds that execute large orders are measured against it: a desk that buys below the day's VWAP did well, a desk that bought above it did badly. That is why price reacts to it. Unlike a moving average, which is a convention, VWAP is a real number institutions are paid or penalised on, and their algorithms lean on it all day. This guide covers how it is built, the three setups it supports, how to read its slope and bands, and the mistakes that cost intraday traders money, including the one specific to forex.
What VWAP measures
From the session open, VWAP = Σ(price × volume) ÷ Σ(volume), updated with every bar. Early in the session a few bars dominate and the line swings; by mid-session it is heavy and moves slowly. Two consequences follow. First, it anchors to the session: VWAP from Monday means nothing on Tuesday, which is why the standard version resets at the open. Second, it is cumulative: a big-volume move early in the day pulls VWAP toward it and holds it there. Most platforms add bands at one and two standard deviations of price around VWAP, which turn it from a line into a map of where the day's trading has been concentrated.
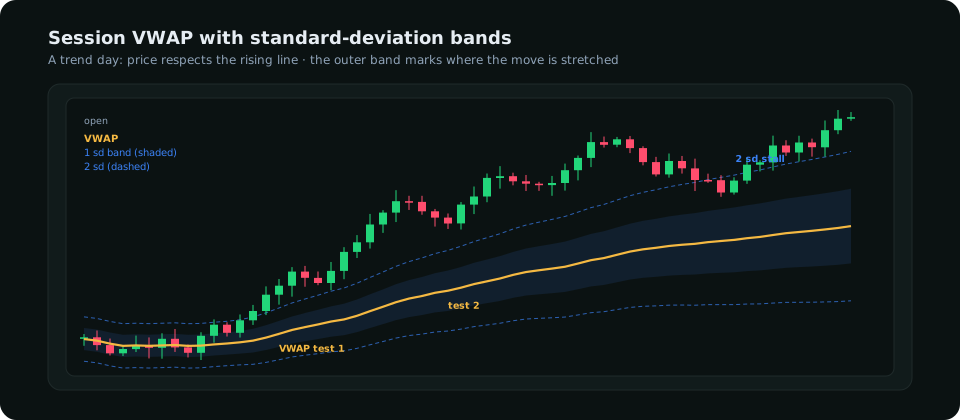
Reading the slope and the position
| VWAP slope | Price vs VWAP | Read | Preferred setup |
|---|---|---|---|
| Rising | Above, pulling back to it | Trend day up; buyers are paying average or better | Pullback long at VWAP |
| Falling | Below, rallying to it | Trend day down | Pullback short at VWAP |
| Flat | Oscillating through it | Range day; VWAP is the centre | Fade the outer band back to VWAP |
| Rising, then price loses it | Closes below after holding above | The trend's buyers are under water; often a reversal | Wait for a reclaim or a failed reclaim |
The slope is decided in the first hour and rarely changes after. If you take one thing from this guide: a rising VWAP is a day to buy pullbacks, a falling one a day to sell rallies, and a flat one a day to fade extremes. Fighting the slope is the most common VWAP mistake.
Three setups
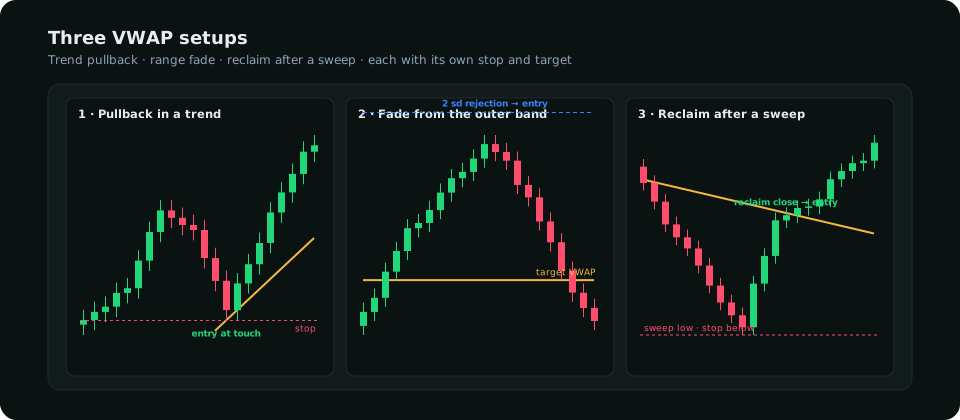
1. Pullback in a trend
On a day where VWAP is clearly sloped, price pulling back to touch it is where the algorithms benchmarked against it add. Enter on a rejection at the line (a wick through and a close back on the trend side), stop beyond the pullback's extreme, target the prior session extreme or the outer band. The first test is the best; the third test in a day is usually the one that fails.
2. Fade from the outer band
On a flat-VWAP day, the two-sigma band is where the day's move is statistically stretched. A rejection at the band is a trade back toward VWAP, not through it. Stop beyond the band's extreme; target the line itself. The setup fails on trend days, which is why the slope check comes first, and it fails into a scheduled release, which is why the calendar check comes before that.
3. Reclaim after a sweep
Price drops below VWAP, takes out the lows below the one-sigma band where stops are, then closes back above VWAP with a wide-range candle. That is a liquidity sweep expressed in VWAP terms, and the reclaim is the entry. Stop below the sweep low, target the upper band. The failed version, where price cannot close back above, is equally informative: the trend has changed.
The forex-specific caveat
Spot forex has no central exchange, so the "volume" your platform feeds into VWAP is tick volume (the number of price changes), not contracts traded. Tick volume correlates reasonably with real activity, so VWAP on a major pair still behaves, but it is less precise than on a futures contract. Two fixes: run VWAP on the currency future (6E for the euro, 6J for the yen) where real volume exists and use it as the reference for the spot chart, or accept the tick-volume VWAP and give its levels a wider tolerance. On gold, use the GC futures chart; its VWAP is one of the cleanest intraday references there is. The MT5 chart setup guide shows where VWAP sits in a clean layout and the indicator overview covers what the others measure.
Common mistakes
- Trading against the slope. Buying at VWAP on a falling-VWAP day is catching a knife with a benchmark attached.
- Using it in the first fifteen minutes. The line is too light; it swings with every bar. Let it settle.
- Treating it as support or resistance. It is a magnet and a benchmark, not a wall. Price trades through it constantly; the information is in whether it closes back.
- Ignoring the session. A VWAP anchored to midnight on a pair that only moves from London open is averaging six hours of noise. Anchor it to the session that matters, or use an anchored VWAP from the London open.
- Stacking it with moving averages. VWAP already does the job the 20-period average is trying to do, with real weighting. One reference line is enough.
- Fading the band into news. A two-sigma stretch before a release is often the first half of a bigger move. Check the calendar.
Where it fits
VWAP is an execution tool, not a bias tool. The direction of the day comes from the higher-timeframe structure and the macro and positioning reads; VWAP tells you where within the day to act on it, and the bands give a stop and a target that are drawn from the day's own distribution rather than guessed. Used that way, in the New York session especially, where futures volume is deepest, it is one of the few intraday indicators that measures something real. Pair it with the ATR for sizing and you have the whole intraday toolkit on two lines.
Frequently asked
Is VWAP good for forex?
Yes, with the tick-volume caveat. It works best on the currency futures and gold futures, and acceptably on major spot pairs during London and New York.
What timeframe should I use VWAP on?
One- to fifteen-minute charts. The line is the same on every timeframe because it is cumulative from the session open; the timeframe only changes how you see the candles around it.
VWAP or moving average?
For intraday, VWAP. It is weighted by activity and anchored to the session; a moving average is neither. For swing trading over days, moving averages are the right tool, because VWAP resets.
Everything on SMC Terminal is analysis and education, not a recommendation to buy or sell. Figures in the example are illustrative. Trading carries a substantial risk of loss. Manage your risk.