Order Block vs Fair Value Gap: Which One Actually Gets Filled? A Rules-Based Comparison
Order blocks and fair value gaps are the two most-marked zones in Smart Money Concepts, and the two most confused. Here is what each one is, the exact rule the terminal uses to mark them, and when one should be trusted over the other.
Ask ten Smart Money Concepts traders to mark the same impulse move and you will get ten different rectangles. Some will draw the order block — the last opposing candle before the move. Some will draw the fair value gap — the imbalance the move left behind. A few will draw both and trade whichever price touches first. Almost none can tell you, with a rule, why they chose the one they chose.
This post fixes that. Both zones are real, both describe the same event from a different angle, and each one is reliable in a specific situation and unreliable in another. The difference is not opinion. It comes from what each zone is made of.
What an order block actually is
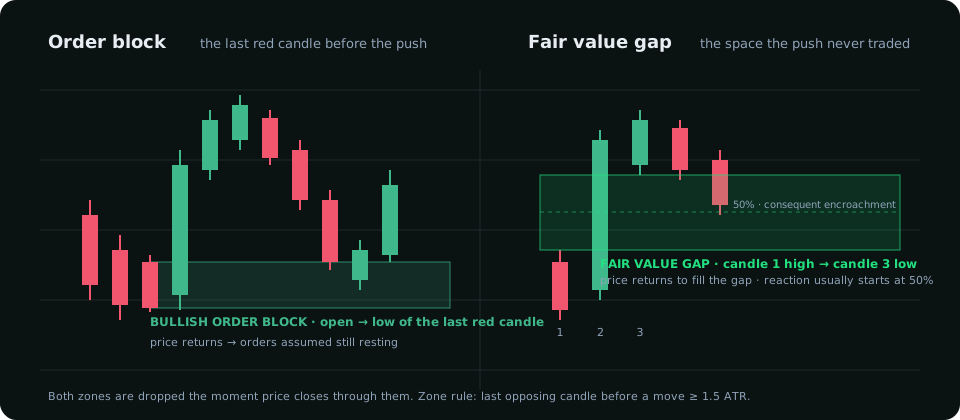
An order block is the last candle that closed against the direction of a strong move, immediately before that move. For a bullish order block: the last bearish candle before an impulsive rally. For a bearish one: the last bullish candle before an impulsive drop.
The logic is about who was filled there. A large buyer who wants size does not lift every offer in one go. He sells a little first — that is the last red candle — to invite shorts in and get filled on the other side, then pushes. The red candle marks where his buy orders were being filled. When price returns to it, the assumption is that unfilled orders are still resting there.
The terminal marks an order block with one rule, so every chart is marked the same way: the last opposing candle before a move of at least 1.5 ATR, zone from the candle's open to its wick on the far side, dropped the moment price trades through it on a close. A zone that has been touched once but held is "tested"; one that has never been touched is "fresh". That is the whole definition — no discretion, no re-drawing after the fact.
What a fair value gap actually is
A fair value gap is the empty space left by a move that was too fast for both sides to trade. Take three consecutive candles. If the high of the first and the low of the third do not overlap — the middle candle's body is so long that it left a gap between them — that gap is the imbalance. Price moved through those levels with no two-way auction. Only one side traded.
The logic here is about efficiency, not orders. Markets like to revisit levels that were never properly traded, because the participants who missed the move use the return to get in, and the ones who are trapped on the wrong side use it to get out. The gap is a magnet because it is unfinished business.
Why they are often the same place
Look at the diagram again. The order block is the candle before the push; the fair value gap is created by the push. On a clean impulse the gap sits just above the order block. Price returning to fill the gap is usually also price returning to the top of the order block. This is why traders who draw both find that they overlap most of the time — and why the "OB + FVG" confluence that gets sold as a secret is really one event drawn twice.
The useful question is not "which is better" but "which edge do I trust when they disagree?" They disagree in three situations.
When to trust the fair value gap
When the move was fast and the gap is large relative to the candle that made it. A gap worth half an ATR or more, left by a single candle, is a true imbalance. Price tends to come back and at least partially fill it — the 50% level of the gap (the "consequent encroachment" in ICT's terms) is where the reaction most often starts.
In this case the order block below it is often too far. Price fills the gap, reacts, and never reaches the candle that preceded it. Traders waiting at the order block watch the move leave without them.
When to trust the order block
When the move was steady rather than explosive, and left many small gaps or none. A trending leg built from ordinary candles has no single imbalance worth marking. The only structural anchor is the last opposing candle. Here the order block is the zone and the gaps are noise.
And when the order block has been respected once already. A tested order block that held is stronger evidence than a fresh gap, because it has already shown orders were there. The terminal labels these "tested" for exactly this reason.
When to trust neither
Both zones fail in the same conditions, and this is the part most content leaves out:
- Against the higher-timeframe structure. A beautiful bullish order block on H1 inside a daily downtrend is a place to take profit on shorts, not a place to buy. Zones are where to execute a bias, not a reason to have one.
- After a sweep of liquidity beyond them. If price has already traded through the zone's far edge on a close, the orders that defined it are gone. The terminal drops the zone at that moment; keeping it on the chart "in case" is how traders talk themselves into a second loss at the same level.
- Into a scheduled release. A zone is an assumption about resting orders. A red-folder release cancels those orders. Check the calendar before you trust a zone in the hour around CPI, NFP or a central bank.
A rules-based way to combine them
Here is the sequence the terminal follows, and the one we would suggest for a discretionary chart too:
- Decide the direction on the higher timeframe first. No zone matters until you know which way you want to trade.
- Mark the order blocks with the 1.5 ATR rule. Keep only the ones price has not closed through.
- Mark the fair value gaps left by the same moves. Keep only the ones at least a third of an ATR tall.
- Where a gap sits inside or just above a block in your direction, that overlap is the area of interest. Where they are separate, the gap is the first area and the block is the second.
- Enter on the H1 trigger — a structure shift back in your direction after price reaches the area — not on the touch.
Rule five is the one that turns a zone into a trade. Touching a zone proves nothing. A close that shifts the hourly structure proves the orders were there.
What this looks like in practice
On the Market Trend tab the H1 chart draws the two nearest demand and supply zones each side of price, the 4-hour zone the plan works from, and the area of interest it has chosen — the nearest actionable one, with the entry refined to the H1 zone inside it when there is one. The refinement is where the order block and the gap overlap. When the plan says "wait for the pullback into 4,166–4,169", that range is the overlap, not a guess.
If you want the longer read on how the area is chosen — and why the terminal stopped sending people to a 4-hour zone a hundred points away — it is in The Sweep Before the Move.
Everything on SMC Terminal is analysis and education, not a recommendation to buy or sell. Manage your risk.
More from the desk
All posts →