Forex Volatility Explained: How to Measure and Adapt to Market Conditions
Forex market volatility decides how wide a stop must be, how big a position can be, which strategy earns and which bleeds — yet most traders never measure it. This guide explains the practical measures (ATR, daily range, realised and implied volatility), how volatility moves through the day and the week, how to classify the current regime, and the concrete adjustments to stops, size, targets and strategy for each.
Volatility is how much a market moves in a given time. It is not direction, and it is not risk in the sense of "danger" — a quiet market can be the riskier one for a breakout trader, a wild one for a scalper. What volatility is is the scale of everything else: the same 30-pip stop is generous in one regime and hopeless in another, the same 0.5-lot position is 1% of the account in one week and 3% in the next. This guide is about measuring it properly and then changing the right things when it changes.
The measures that matter
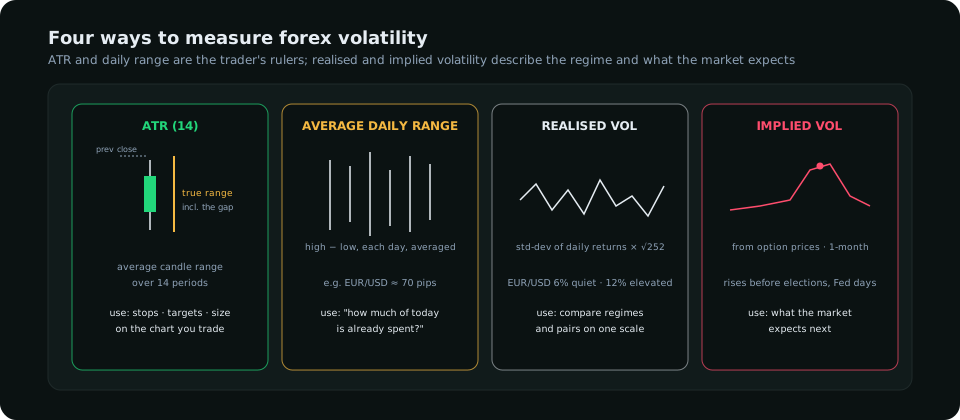
| Measure | What it is | Use it for |
|---|---|---|
| ATR (Average True Range) | The average candle range over N periods, including any gap from the previous close; 14 is standard | Stops, targets and size on the timeframe you trade; the ruler for everything |
| Average daily range (ADR) | The average of high − low per day over 10–20 days | "How much is left today?" — once a pair has moved 90% of its ADR, the day's range is mostly spent |
| Realised volatility | The standard deviation of daily returns, annualised (× √252) | Comparing regimes and pairs on one scale; EUR/USD at 6% is quiet, at 12% is elevated |
| Implied volatility | What option prices say the market expects, e.g. 1-month EUR/USD vol | Knowing when the market itself expects a big move (ahead of elections, central-bank decisions) |
The first two are on every charting platform. Realised volatility is a spreadsheet calculation; implied volatility is published by options venues and some data providers. A trader needs ATR daily, ADR during the session, and a sense of where realised volatility sits against its history to know the regime.
How volatility moves
Through the day
Forex volatility follows the sessions. The Asian hours produce 20–30% of a pair's daily range; the London open and the London–New York overlap produce most of the rest; the US afternoon fades. A 15-pip hourly ATR at 03:00 UTC and a 45-pip hourly ATR at 13:00 UTC are the same pair on the same day. Intraday stops and targets must be set against the session's ATR, not the day's. The session guide maps the hours.
Through the week and the calendar
Monday mornings and Friday afternoons are quieter; central-bank days and the first Friday of the month (US payrolls) are not. An economic calendar with impact ratings is a volatility forecast: a red event compresses volatility in the hour before and releases it in the minutes after.
Across pairs
Typical ADRs differ by a factor of three or more: EUR/USD and USD/CHF around 60–80 pips, GBP/USD 90–120, GBP/JPY 130–180, gold $35–60. A fixed pip stop that suits EUR/USD is wrong on GBP/JPY, and the lot size has to differ accordingly — the lot size calculator guide works through it.
Classifying the regime
The practical tool is the 14-day ATR compared with its own 100-day average. Four regimes, one line each:
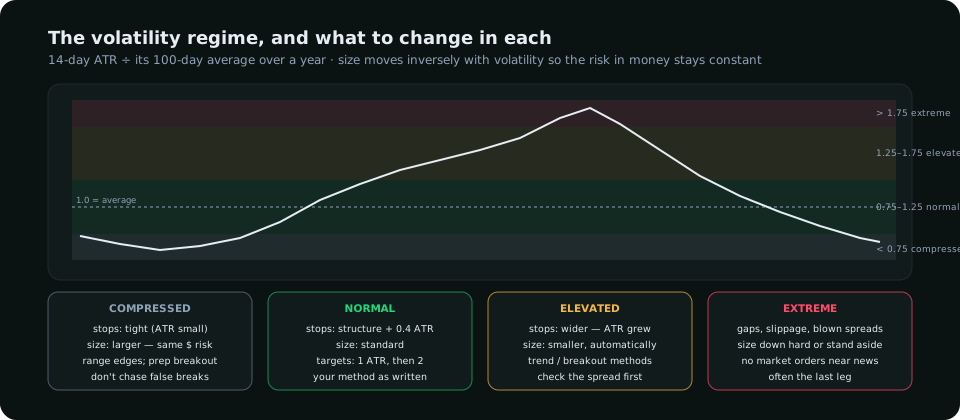
| Regime | ATR ÷ 100-day avg | What it looks like | Strategy that earns |
|---|---|---|---|
| Compressed | < 0.75 | Narrow ranges, overlapping candles, false breaks | Range trades at the edges; prepare for the breakout, don't chase it |
| Normal | 0.75 – 1.25 | Ordinary session rhythm | Whatever your method is; standard parameters |
| Elevated | 1.25 – 1.75 | Wide candles, directional days, sweeps run further | Trend following and breakouts; wider stops, smaller size |
| Extreme | > 1.75 | Gaps, slippage, spreads blown out, stops jumped | Size down hard or stand aside; the blow-off is often the last leg |
What to adapt, and how
Stops: in ATR, never in fixed pips
A stop beyond the structure or the sweep plus 0.3–0.5 of the timeframe's ATR scales itself: wider when the market is wild, tighter when it is calm. A fixed 20-pip stop on EUR/USD is comfortable at an ATR of 60 and gets hit by noise at an ATR of 120.
Size: inversely with volatility
Because size is derived from the stop (risk ÷ stop distance), a wider ATR stop automatically produces a smaller position, and the risk in money stays the same. This is the single most important adaptation and it is free once the stop is in ATR. A trader who keeps the same lot size through a doubling of volatility has doubled their risk without a decision.
Targets: measured in ATR too
A first target one daily ATR from entry is reached on most trending days; two ATRs is a strong day. Targets set in fixed pips are either too close in elevated volatility, leaving money on the table, or too far in compression, never reached.
Strategy: match the regime
The strategy guide makes this point from the other side: trend following earns in elevated volatility and bleeds in compression; reversal trading does the reverse; breakout trading earns at the transition out of compression. A trader with one method should know which regime it needs and reduce size, or stop, in the others.
Spreads and execution
Spreads widen with volatility and explode in the extreme regime. A 10-pip scalp with a 1-pip spread is a different trade at a 4-pip spread. Check the spread on the ticket before entering in elevated conditions, and avoid market orders in the seconds around a release.
Volatility and the other reads
Volatility rarely changes on its own. A jump usually has a cause — a rate-expectations shift, a risk shock, a positioning unwind — and the cause says whether the new regime will last. A volatility spike with speculators at a positioning extreme is often the unwind of that position, which exhausts itself; a spike driven by a change in the rate outlook tends to start a trend. Reading volatility beside positioning and the drivers, as a research dashboard or a few extra charts allow, turns "it's volatile" into "it's volatile because X, so expect Y".
A daily volatility check, in one minute
- Daily ATR (14) and its ratio to the 100-day average → the regime.
- ADR, and how much of it today has already used → how much is left.
- Red events today → when the regime may change.
- Stop distance for the planned trade in ATR → the size that follows.
Done every morning, this is the difference between a method that works in one kind of market and one that survives all of them.
Everything on SMC Terminal is analysis and education, not a recommendation to buy or sell. Ranges and thresholds are typical values for illustration. Trading carries a substantial risk of loss. Manage your risk.